Climate documents miscellaneous documents for understanding climate By various contributors (2010)
www.seafriends.org.nz/issues/global/climate6.htm
For a long time now, the blogosphere has been
resounding with contributions from many experts. Some of these, relevant
to understanding climate on Earth, have been collected here for ease of
reference and to make sure these gems are not lost.
Harry Dale Huffman compares Venus with Earth at comparable atmospherees
between 0.2 and 1 bar, our troposphere and finds no difference, which means
that greenhouse gases play no role in the troposphere.
Harry Dale Huffman discovers an important physical impossibility, overlooked
by mainstream science. Inside a passive system, as our atmosphere is, one
cannot have energy transfers exceeding that of the incoming energy. Yet
Kiel & Trenberth did, which became the basis for IPCC circulation models.
Professor Robert W. Wood's experiment with closed boxes is confirmed
by John O'Sullivan, leading to a resurgence of proof that the world
is not cooled by reradiation from the surface, but by conduction and convection.
Updated by Nasif Nahle and others. Very important reading!
Since 2006, NASA has been making predictions about the forthcoming
Solar Cycle 24, based on computer models and their 'understanding of the
Sun's conveyor belt'. Quite laughable.
Exclusive Japanese scientists have made a dramatic break with the UN
IPCC and Western-backed hypothesis of climate change in a new report from
its Energy Commission. Febrary 2009.
Earth's climate system is ridiculously complex. To assume that we know
enough to exclude all parameters but CO2 in order to explain observed warming,
is absurd.
Roy Clark explains that radiative forcing is a purely fictional
concept that was introduced in its current form by Manabe and Wetherald
in 1967. As it forms the basis of the IPCC, their science of global warming
is voodoo science. Important.
Note! for best printed results, read tips
for printing. For corrections and suggestions, e-mail
the author.
-- Seafriends home -- -- Rev:20100416,20110702,20110906,20120302,20131110,
The significance of Venusian
climate by Dr Hartwig Volz
May 2000
.........
The discussion of Venus or Mars in the context of earth's climate irritates
me for years. One can read quite some oddities from promoters of the potentially
dangerous greenhouse effect and of sceptics alike. This communication is
meant to be a primer how to calculate or at least reasonably estimate Venus'
ground temperature.
The data on these sites are compared with corresponding parameters on
earth.
According to textbooks on astronomy it is generally assumed that the
inner planets (Earth, Venus, Mars among them) are formed from the debris
of a dying star (presumably a supernova explosion) some 5*10^9 years ago.
On earth only a very few naturally radioactive mother nuclides (from potassium,
rubidium, thorium, uranium) have survived this long time, all with half
life times above 10^8 years. These nuclides and their daughter nuclides
generate a geothermal heat flow of round about 0.2 W/m² on average,
naturally unevenly distributed over the surface of earth. Because of the
same astronomical origin it is safe to assume that the Venusian heat flow
is in the same order of magnitude and thus negligible compared to the energy
by insolation. (No "young planet", no impact whatsoever. Note that an impact
would hit the outer planets Saturn and Jupiter with much higher probability
because of their sheer size and gravity). This was stated correctly by
your colleagues. Correct is also that the black body radiation temperature
of Venus is lower than earth's, because of the higher albedo (see link
venusfact).
Calculation of lapse rate, kinetic gas theory, basic thermodynamics
Basic thermodynamics of a planet with atmosphere can best be understood
by an experiment of thought:
1. Imagine a planet-like star without rotation and with a nitrogen atmosphere,
located in space without any short or long wave background radiation, and
heated from the inside with 240 W/m². By Stefan-Boltzmann's law one
calculates the surface temperature of the star to be 255 K (the famous
temperature of earth without a greenhouse effect). But what is the temperature
or temperature distribution of the atmosphere? Molecules moving upwards
are slowed down by gravity (this means a cool-down in kinetic gas theory),
those moving downwards are speeded up (which means a warming). By the movement
potential energy (Epot) is transformed in kinetic energy (Ekin) of molecules
and vice versa.
A more detailed analysis shows that also rotational energy (Erot) -
in the case of molecules made up of 2 atoms - has to be taken into account.
If you wait long enough, the atmosphere of the motionless star would be
without motion by itself and its energy evenly distributed. You can write
for the total atmospheric energy (Etot):
Etot = Epot + Ekin + Erot (1)
Any layer of the star's motionless atmosphere has the same energy Etot;
but because Epot varies with altitude, also Ekin (i.e. temperature) varies
with altitude. With some thermodynamical transformation you get from (1)
dT/dz = -g/cp (2)
which is identical with the equation one finds in textbooks on meteorology
for the dry (or sometimes called theoretical) adiabatic lapse rate. dT/dz
is the temperature gradient of the atmosphere, g is the star's gravitational
acceleration and cp is the specific heat of the atmospheric gas at constant
pressure (in this example cp incorporates the sum of Ekin and Erot). Applying
this knowledge to above example with earth parameters g = 9.78 m/s²
and cp = 1005 J/(kg*K), one calculates dT/dz = - 0.0097 K/m or the well
known ~ -1K/100m. For various theoretical reasons the experimentally determined
dry adiabatic lapse rate of earth is somewhat lower with 0.75K/100m, but
in the same order of magnitude. Border temperature conditions are 255 K
at the surface and 0K as temperature of space, from which one gets a formal
thickness z of 26 km of the atmosphere.
2. As a second example, imagine the same motionless star heated from
inside, nitrogen atmosphere, no background radiation from space, but by
some experimental trick the lower 10 km of the atmosphere densely covered
with fog and clouds. After waiting long enough, the atmosphere would again
be motionless. One now has introduced very many black body radiators in
the lower atmosphere. Seen from space, one would still measure the radiation
of a 255K black body, but this time the radiation originates from the top
of the cloudy part of the atmosphere, i.e. from an atmospheric altitude
of 10 km. What is the temperature distribution of the atmosphere? To the
energies of equation (1) radiation energy (Erad) must be added, either
positive for absorbed energy or negative for emitted energy (Eradabs and
Erademi).
Etot = Epot + Ekin + Erot + Erad (3)
Compared to example 1 nothing does change above the cloud cover, because
no energy can be absorbed or emitted there. Obviously an atmospheric layer
within the fog or clouds is sandwiched by and absorbs black body radiation
from a warmer layer below and a cooler layer above, in stationary state
emitting the average in both directions. This is why in a motionless atmosphere
the radiation term averages to zero, and the lapse rate is the same within
or outside the clouds. The point is however: The altitude of effective
radiation to space has been shifted to an altitude of 10 km, and the lower
foggy atmosphere adds another 97 K from the 255K-10km layer to ground.
Ground temperature in example 2 would be 352 K, uncomfortably hot, though
only heated by 240 W/m². Note that this has nothing to do with greenhouse
gases, just with very simple and straight-forward physics, thermodynamics
and black body radiation. Before discussing an example 3 (Venus), some
additional information.
Venusian atmosphere and spectroscopic properties of CO2
As can be seen from above link, partial pressure of CO2 in the Venusian
ground atmosphere amounts to ~89 bar and ground temperature to 737 K on
average. The "critical point" data of CO2: p(crit.) = 72.9 bar; T(crit.)
= 304 K (handbook of physics). A substance beyond the critical point is
neither gas nor fluid, though in general referred to as supercritical fluid.
It surely is not a gas and very surely not a trace gas. It is very important
to note that the evaporation enthalpy of a substance beyond the critical
becomes zero; this means there exists no cooling effect by evaporation,
which is a very important energy transfer and cooling mechanism on earth.
Though I have never seen the absorption or emission spectrum of a supercritical
fluid, it seems safe to me to assume that such a substance behaves like
a black body, not like a line or band absorber (cf. a very moist atmosphere,
where water - far away from its critical point - starts behaving like a
black body). Anyhow, it definitively does not make sense to extrapolate
spectroscopic data of a trace gas to its supercritical conditions. And
it definitively does not make sense to directly compare the physics of
atmospheric band radiation (greenhouse gases) with the black body radiation
of fog or clouds.
Back to Venus. According to a handbook of astronomy the top of clouds
of Venus is in an altitude of about 65 km, at a pressure level of 0.2 bar.
Actually the altitude of the atmosphere can be optically seen, because
at the transition zone of day and night the scattered twilight looks like
a sickle reaching in the night zone. Day temperature at 65 km is about
300 K, night temperature slightly below 200 K (with question mark, I cannot
read the figure more precisely). Black body radiation temperature is 232
K. So there will be an above cloud greenhouse effect, but nothing overly
exiting.
3. As a third example, imagine a planet-like star without rotation and
with a 3-atomic atmosphere, located in space without any short or long
wave back ground radiation, and heated from the inside with 163 W/m².
By Stefan-Boltzmann's law, neglecting the greenhouse effect, one calculates
the surface temperature of the star to be 232 K (I hope that NASA has calculated
correctly; I did not check this one). Now modification by some experimental
trick: the lower 65 km of the atmosphere densely covered with fog and clouds.
After waiting long enough, the atmosphere would again be motionless. One
now has introduced very many black body radiators in the lower atmosphere.
Seen from space, one would still measure the radiation of a 232 K black
body, but this time the radiation originates from the top of the cloudy
part of the atmosphere, i.e. from an atmospheric altitude of 65 km. What
is the temperature distribution of the atmosphere? (Sorry for this one;
it is just the ease of copying).
Because no greenhouse effect (no net energy transfer) exists between
atmospheric layers of very similar temperature, equation (2) can still
be applied, at least in good approximation. Venus parameters for equation
(2): g = 8,87 m/s²; cp = 1294 J/(kg*K) at 1 bar and 4166 J/(kg*K)
at 84 bar (handbook of physics; hopefully you can see from these data alone
that a supercritical fluid is not a gas). dT/dz with 1 bar data: -6.9K/km;
delta T over 65 km of cloudy layer: 449 K. Surface temperature of Venus
449 + 232 = 681 K. dT/dz with 84 bar data: -2.2K/km; delta T over 65 km:
138 K. Surface temperature 370 K. Ok, this one is really too low, but it
should be kept in mind that only a small fraction of the near ground atmosphere
is supercritical. Also my top of the clouds altitude is presumably not
very precise. Anyhow, the point of this message is that it does not make
sense to attribute these ground temperatures to a greenhouse effect of
trace gases. The physical reason is outlined above, quantifying the experimental
observation rather satisfying.
I close this communication with a temperature emission spectrum of earth
and mars, one of my favourites (ordinate radiation temperature, abscissa
wave number). Note that the CO2-forcing of mars and earth (the integer
of the triangle and trapezoid, respectively) are of about the same size.
Here the distance of the planet to sun makes on important part of the difference.
Not so with Venus. The important thing with Venus is the huge z in the
dT/dz term, causing a huge delta T. By the way, could anybody provide me
with an emission spectrum of Venus, comparable to the one below? I have
also seen spectra from Jupiter and Saturn, but never from Venus.
The flip side of the entrenched incompetence in science today is that
all it takes is scientific competence to make revolutionary discoveries,
or fundamental corrections to current dogma. Being a competent physicist
rather than an incompetent climate scientist (which 97% of them demonstrably
are), I was able recently to post an answer on yahoo.com to a question
about the greenhouse effect on Venus, an update to which I give here:
Surprisingly to most, there is no greenhouse effect at all, and you
can prove it for yourself.
From the temperature
and pressure profiles for the Venusian atmosphere, you can confirm
that, at the altitude where the pressure = 1000 millibars, which is the
sea level pressure of Earth, the temperature of the Venusian atmosphere
is 66ºC = 339K.
This is much warmer than the temperature at the surface of the Earth
(at pressure = 1000 millibars), which is about 15ºC = 288K. HOWEVER
Venus is closer to the Sun, and gets proportionally more power from
it. Earth is 93 million miles from the Sun, on average, while Venus is
only 67.25 million. Since the intensity of the Sun's radiation decreases
with distance from it as 1 over r-squared, Venus receives (93/67.25) squared,
or 1.91 times the power per unit area that Earth receives, on average.
Since the radiating temperature of an isolated body in space varies
as the fourth-root of the power incident upon it, by the Stefan-Boltzmann
law, the radiating temperature of Venus should be the fourth-root of 1.91
(or the square-root of 93/67.25) = 1.176 times that of the Earth. Furthermore,
since the atmospheric pressure varies as the temperature, the temperature
at any given pressure level in the Venusian atmosphere should be 1.176
times the temperature at that same pressure level in the Earth atmosphere,
INDEPENDENT OF THE DIFFERENT LEVELS OF INFRARED ABSORPTION in the two atmospheres.
In particular, the averaged temperature at 1000 millibars on Earth is about
15ºC = 288K, so the corresponding temperature on Venus, WITHOUT ANY
GREENHOUSE EFFECT, should be 1.176 times that, or 339K. But this is just
66ºC, the temperature we actually find there from the temperature
and pressure profiles for Venus.
[Note: The derivation of the radiating temperature above is for absolute
temperature, in degrees Kelvin (K), so the 1.176 factor relates the Kelvin
temperatures, not the Celsius temperatures.]
So
there is no greenhouse effect. You have just proved that climate science
is utterly wrong to think otherwise. This is the scandal that so many "experts"
in climate science, and all the scientific authorities, will not face.
Listen to the physicists that tell you there is no greenhouse effect; they
know without having to go to the Venus data -- and I am one of them. The
continuing incompetence on this vital point among so many scientists, for
more than a century, is amazing, and tragic. Here is a table more precisely
comparing the temperatures at various pressures in Earth's atmosphere (the
standard atmosphere) with the corresponding temperatures in Venus's atmosphere.
(updated 12/02/10)
My uncertainty in finding T_Venus from the graphs is +/- 1.4 K, so any
error less than about 1.2 K (in the last column) is negligible. I don't
know why the comparison falters slightly between 600 and 300 mb, or why
it improves suddenly at 200 mb (~60 km altitude), but the Venus cloud top
is given as 58 km, between the 300 and 200 mb levels.
The Venus atmosphere is 96.5% carbon dioxide, and supposedly superheated
due to a runaway greenhouse effect, yet that portion of it within the pressure
bounds of the Earth atmosphere is remarkably like the Earth in temperature.
This is student-level analysis, and could not have been neglected by climate
scientists, if they were not rendered incompetent by their dogmatic belief
in the greenhouse hypothesis. (Again, the overwhelming extent of fundamental
incompetence exhibited by scientists today is the real underlying story.)
This result also flies in the face of those who would say the clouds of
Venus reflect much of the incident solar energy, and that therefore it
cannot get 1.91 times the power per unit area received by the Earth --
the direct evidence presented here is that its atmosphere does, in fact,
get that amount of power, remarkably closely. This in fact indicates that
the Venusian atmosphere is heated mainly by incident infrared radiation
from the Sun, which is not reflected but absorbed by Venus's clouds, rather
than by warming first of the planetary surface. (It also indicates that
the Earth atmosphere is substantially warmed the same way, during daylight
hours, by direct solar infrared irradiation, and that the temperature profile,
or lapse rate, for any planetary atmosphere is relatively oblivious to
how the atmosphere is heated, whether from above or below.) This denies
any possibility of a "greenhouse effect" on Venus (or on Earth), much less
a "runaway" one. This has already been pointed out recently by physicists
Gerlich and Tscheuschner, who have written succinctly, "...since the venusian
atmosphere is opaque to visible light, the central assumption of the greenhouse
hypotheses [sic] is not obeyed." Yet they are ridiculed by climate scientists,
who thus behave like spoiled children who refuse to be chastised by their
parents.
Another way to look at the Venus/Earth data is this:
Venus is 67.25 million miles from the Sun, the Earth, 93 million.
The radiating temperature of Venus should be 1.176 times that of the
Earth.
Without ANY greenhouse effect as promulgated by the IPCC, at any given
pressure within the range of the Earth atmosphere, the temperature of the
Venus atmosphere should be 1.176 times that of the corresponding Earth
atmosphere.
The facts:
at 1000 millibars (mb), T_earth=287.4 (K), T_venus=338.6, ratio=1.178
at 900 mb, T_earth=281.7, T_venus=331.4, ratio=1.176
at 800 mb, T_earth=275.5, T_venus=322.9, ratio=1.172
at 700 mb, T_earth=268.6, T_venus=315.0, ratio=1.173
at 600 mb, T_earth=260.8, T_venus=302.1, ratio=1.158
at 500 mb, T_earth=251.9, T_venus=291.4, ratio=1.157
at 400 mb, T_earth=241.4, T_venus=278.6, ratio=1.154
at 300 mb, T_earth=228.6, T_venus=262.9, ratio=1.150
at 200 mb, T_earth=211.6, T_venus=247.1, ratio=1.168
(Venus temperatures are +/- 1.4K, Earth temp. are from std. atm)
The actual ratio overall is 1.165 +/- 0.015 = 0.991 x 1.176. It does
not vary from the no-greenhouse theoretical value at any point by more
than about 2%.
There
is no sign whatever of a greenhouse effect on either planet. The fact that
the temperature ratios are so close to that predicted solely by their relative
distances from the Sun tells us that both atmospheres must be warmed, overall,
essentially in the same way, by direct IR solar irradiation from above,
not by surface emissions from below. Keeping it simple, the atmospheres
must be like sponges, or empty bowls, with the same structure (hydrostatic
lapse rate), filled with energy by the incident solar radiation to their
capacity to hold that energy.
There is no greenhouse effect on Venus with 96.5% carbon dioxide, and
none on the Earth with just a trace of carbon dioxide.
The finding of the great design of the "gods" immediately confronts
science with the fact that our most popular and hotly-defended theories
in the earth and life sciences are fundamentally wrong. Plate tectonics
is laughably wrong, since the landmasses of the Earth are shaped and distributed
according to a clear and precise, dodecahedral design; evolution is not
even a theory, it is a misplaced metaphysical principle of human learning,
wrongly applied to physical reality because scientists refuse to recognize
design as design, or to believe anyone smarter than us once trod the Earth.
The intellectual climate today is so bad, however, that no one in science
is interested in learning fundamental new knowledge. Learning a scientific
specialty is hard--the hardest part is memorizing a lot of terms, and keeping
their essential relationships clear in the face of complex, deteriorating
arguments. For example, no biologist I am aware of knows any more that
"evolution" properly means "change in a given direction"; they are too
full of the supposed success of undirected evolution.
The point I am getting to is that when science gets off track, there
are always clues, perhaps small but clear, that it is off track. When it
is really wrong-headed, as it has become since Darwin's day, you can find
instances of blatantly ridiculous results being promulgated as the best
science consensus. The prime example of this at the moment is the global
warming controversy.
I have not addressed global warming in an article before now, because
I don't fancy myself a universal polymath: Climate science is not my field.
So I won't bother putting up yet another article that supposedly sets everyone
straight on climate science, or global warming in particular. If you study
the many different points of view presented online, from qualified scientists,
you should find that climate science is, in fact, not a robust science.
It is mired in fundamental controversies and incompetence, and poisoned
beyond immediate cure by one-sided politicization that fans hysteria among
the unknowing public.
What I will do is put before you just one example of a ridiculous result
from climate science that I, as a physical scientist, have observed, and
which I have not seen other scientific critics bear down on as they should.
I think, indeed, that they don't know that it is ridiculous, and I don't
know yet whether that thought is a misapprehension on my part, or scientists
in general have been rendered simply stupid by the wrong-headedness of
their general paradigm, of undirected evolution of all that we see in the
universe--not just the life on Earth, but the Earth itself, for example
(and of course, the solar system beyond, which I have proved to my own
professional satisfaction is part of the great design I found and verified).
Here it is, the little point of ridiculousness I currently marvel over:
The "atmospheric greenhouse effect" at the heart of the bad science put
out by the "consensus", touted by the United Nations IPCC (Intergovernmental
Panel on Climate Change), is summarized in the following illustration,
of the supposed "energy budget" of the Earth's surface and atmosphere:
Earth's
Energy Budget, from Trenberth and Kiehl, 1997 This illustration purports to show how the initial power incident on
the Earth from the Sun is divided among the many processes going on in
the atmosphere, and between the atmosphere and the Earth's surface. It
all looks straightforward enough, but then when you look closely you see
something strange, off on the right side: The radiation coming off the
surface is huge, and there is an almost equally huge "back radiation" from
the atmosphere to the surface. To a physicist--or at least to this physicist--that
strange, gigantic loop of energy between the atmosphere and the surface
appears unphysical, out of all proportion to the rest of the diagram.
And we don't have to get into detailed physical theory or wordy explanations
to pin down what's wrong with it: The power coming off the surface (the
number 390) is larger than the incident power from the Sun (342). (The
power shown as back radiated by the atmosphere is about as large as that
from the Sun, too.)
Just that one fact is enough for me to see that the "climate science"
of the U.N. and the consensus of (so we are told) 97% of all climate scientists--is
absurd. No part of the "global energy budget" can be greater than the incident
energy. Either their numbers are wrong, or the model being illustrated
is wrong. Period, full stop. You don't have to know, or explain to the
world, what is really going on, or why there has been recent "global warming".
Just know their explanation is nonsense, basic physics absolutely and undeniably
forbids it. Everything else you read is either other scientists trying
to show they know what is really going on (which obviously no one does
at this point, entirely), or scientists or their followers trying to defend
the indefensible, with complex, technical and always wrong-headed arguments.
Of course, that unphysical loop of excess energy is just what they are
calling the "greenhouse effect". And it is garbage, and all the scientists
who deny that, or refuse to see it for what it is, should be drummed out
of science, or at least be required to undergo re-education. Because they
are worse than first-year students, who are generally at least open to
learning the hard truth.
I am more concerned with the new knowledge I have found, however, and
how it relates to the current incompetence across all of science. The harder
I have tried to put forward my new knowledge, the more widespread and confrontational
has been the public exhibition of epidemic incompetence in science. I know,
as a fact, that the Earth was deliberately put together, in exquisite detail,
and that it was changed, wholesale but not fundamentally, less than 20,000
years ago. I know the logical hysteria to which so many scientists have
been driven by their wrong-headed paradigm, is what we are seeing in the
promulgation of "runaway climate change". This same hysteria is behind
the closed-minded defense of current theories, and the simplistic and relentless
presentation of them to the public as facts, across all the physical sciences.
Through such hysteria and continual, vain argument, dogma is being revealed
to mankind as merely divisive, and like sand, upon which true and lasting
knowledge cannot be built.
Lab
Experiment by John O'Sullivan guest post at Climate Realists: Updated by Nasif S. Nahle
Monday, July 18th 2011, 10:58 AM EDT
http://climaterealists.com/?id=8073 Photo Professor Robert W. Wood - Photo Link & Bio
Greenhouse gas theory of global warming is refuted in momentous Mexican
lab experiment. Results mean epic fail for doomsaying cult and climate
taxes.
Professor Nahle of Monterrey, Mexico backed by a team of international
scientists has faithfully recreated a famous experiment from 1909 to confirm
that the greenhouse effect cannot cause global warming.
Astonishingly, the 1909 greenhouse gas experiment first performed by
Professor Robert W. Wood at John Hopkins University hadnt been replicated
for a century. This despite over $100 billion spent by the man-made global
warming industry trying to prove its case that carbon dioxide is a dangerous
atmospheric pollutant.
The analogy had been that greenhouse gases (e.g. CO2) act like the glass
in a greenhouse trapping heat in Earths atmosphere and if they build up
(due to human industrial emissions) the planet would dangerously overheat.
Nahle Nails Shut Climate Scare Coffin At the Biology Cabinet laboratories Professor Nahle was able to confirm
the astounding findings: Wood was right all along. After peer-review the
results confirm that the so-called greenhouse effect is solely due to
the blockage of convective heat transfer within the environment in which
it is contained i.e. as in this case, a lab flask.
Indeed, it is the glass of the lab flask (or greenhouse) that caused
the trapped radiation all along. The flask (or greenhouse) being what
scientists refer to as a closed system; while Earths atmosphere isnt
closed at all but rather open to space allowing heat energy to freely escape.
Nahles findings shoot holes in claims of Professor Pratt of Stanford
University whose own replication of Woods experiment was touted as the
first official reconstruction of Woods test for a century. Pratt claimed
he had disproved Woods findings.
This is the reason that I decided to repeat the experiment of Professor
Pratt to either falsify or verify his results and those of Professor Wood,
says the Mexican professor at the Biology Cabinet.
The Monterrey science research institute also recreated Woods test
into the effect of longwave infrared radiation trapped inside a greenhouse.
Unlike Pratt it found that Woods findings were correct, absolutely valid
and systematically repeatable. The Bio Cab man affirms, the greenhouse
effect does not exist as it is described in many didactic books and articles.
Put simply, one of the aforementioned professors has their reputation
perilously on the line and Nahle is gunning for an explanation from his
U.S. Rival. A clue to the outcome: Pratt isn't even qualified in science
- he's a (warmist) mathematician specializing in computers.
Satellite Records Back Up Mexican Findings Professor Nahles findings will come as no surprise to anyone who is
up to speed with the other big climate story that has raised huge doubts
over any so-called greenhouse effect. NASA now admits global warming just
isnt happening despite ever-rising levels of CO2.
Laughably, the once illustrious U.S. space agency is blaming no warming
this century on China. The rapidly industrializing nation is emitting so
much sulfur dioxide that it is cooling our planet, they say.
Back Story of Greenhouse Gas Mythology Professor Woods science held sway until the mid 1930's after he proved
that on average, the blockage of convective heat transfer with the surroundings
causes an increase of temperature inside the greenhouses of 10.03 °C
with respect to the surroundings temperature.
After World War Two interest in the GHE was briefly resurrected again.
But the American Meteorological Society shot this down in 1951 after it
reviewed all the available data and produced the "Compendium of Meteorology"
appearing to kill off the cultist claims.
However, fearmongers were finally able to resurrect the notion of a
GHE in the mid 1980's when a certain science adviser to Margaret Thatcher,
Christopher Monckton (not then a Lord), helped promote the idea so as to
aid the defeat of Britains striking coal miners.
Three Sides in the Climate Argument and Two are Wrong Lord Monckton has fastidiously stood by his position that there is
GHE despite prominently publishing his own findings that it just isnt
there. He finds himself on one of three sides at war in the great global
warming debate and only one can be right.
Monckton along with other skeptics such as Richard Lindzen and Roy
Spencer have been labeled lukewarmists for their stubborn adherence that
there must be some warming, however small caused by CO2. They are unlikely
climate bedfellows with the likes of Professor Pratt and are opposed to
the Slayers group of GHE skeptics of which Professor Nahle has become
increasingly prominent.
Another rising star of the Slayers group of scientists, Joe Postma concurs
with Nahles results and says, I will never be convinced of a radiative
greenhouse effect without experimental proof. As it is, I have proven how
the standard application of the Stefan-Boltzmann equation which ostensibly
explains the greenhouse effect is a complete fiction and tautology.
Strident Slayers Begin Global Science Association Postma and Nahle join long-standing GHE skeptics, Alan Siddons and
Hans Schreuder as they prepare to formally launch a new global research
association, Principia Scientific International (PSI) recruiting untold
numbers of conscientious scientists sickened by endemic corruption within
science.
Nahles new paper buttresses Siddons arguments and is earmarked to
set the tone of the no holds barred style of PSI, which will be set up
as an independent (non-governmental) organization eschewing political interference.
With a mission to uphold the scientific method with objectivity and transparency
Nahle and his PSI compatriots insist empirical experimental research as
the only means to prevail over dogmatic (government financed) junk science.
The new organization will be looking for other challenges once the
mainstream finally accepts that it has slayed the climate fraud. But Siddons
insists, greenhouse theory and its associated alarmism only persist because
of a stubborn refusal to question the following two assumptions below.
Assumption One: Gases that absorb infrared light thereby block infrared
light.
Reality: Such gases radiate, i.e., scatter
or spread out the light they absorb, thus releasing light in all directions
rather than blocking it.
Assumption Two: Blocking the exit of light while allowing free entry
will increase the temperature of an irradiated object.
Reality: The light an object emits is a function
of its temperature; its temperature is not a function of the light it emits.
Accordingly, if incoming light raises an object to a certain temperature,
the object will remain at that temperature whether it emits light to its
surroundings or not. Any temperature increase in a confined condition is
only due to reduced convective cooling.
Such clear cut and plain-speaking objectivity, plus a wholesale return
to the traditional scientific method, is the only acceptable paradigm for
this emerging intellectual and scientific force.
-------------------------------------
Proving
the greenhouse gas effect does not exist! By Berthold Klein P.E November 16, 2010 revision 11-19-2010 REVISED
STARTING JULY 4,2011
PREAMBLE: After hearing from a Ph. D in mechanical engineering and
a teacher of environmental studies that they could not follow this experiment
it is necessary to rewrite this experiment. It is necessary that anyone
that can read to be able to understand this experiment and what it means.
I made a mistake in the first edition as it is created as I thought about
it and did the experiment. This edition is for everyone -the man on the
street who would suffer the most by government 1984 Big Brother control
and the Ph. D in social studies or science.
I have been communicating with some ordinary people and some Ph.
D's and I realize that my mission is a Mission Impossible being able
to read does not mean that the reader can comprehend and that having a
Ph. D means that their ego and arrogance will get in the way of comprehension.
I will do my best with the help of those that edit the new version , so
here goes. Before this is released it will have been reviewed and edited by
knowledge individuals most will have minimal science education but do understand
that the Greenhouse Gas effect does not exist.
There are several words or terms used in this revision that need
some explanation:
IR= infrared radiation is a form of radiation (invisible light also
know as heat rays) that is present in sun light and is also radiated by
every body of mater whether it is a gas, a liquid or a solid. If it is
a living thing it will radiate more IR that if it is an inanimate object
because of its temperature.
IRag= Certain gases will absorb different wavelengths of radiation (a
characteristic of the light ) depending on the construction of the gas.
Some gases do not absorb IR , their construction will not allow them to
absorb the IR, they may absorb other forms of radiation but as was said
above they still radiate IR. Many other materials including water will
absorb IR. These should not be included in the term IRags. The words greenhouse
gas effect has never been proven by creditable scientific experiments
and therefore will only be used when absolutely necessary.
Water/l/v/s=Water has some very important characteristic that are important
to earth and to live on earth. Because of earth's fortunate location in
the universe, its temperature varies from a low of -90 F to a high 130
F+. But in the majority of the earth temperatures are between 0 F to 100
F. and water can change from a gas at all temperature, to a liquid at 32F(0C)
or above, and a solid below 32 F.(0 C). Many people who pretend to be scientists
choose to ignore these facts and call Water/l/v/s a greenhouse gas As
we go through this experiment it will become clearer why this is bad science.
CO2= a gas that is breathed out by every living mammal and most other
living creature, it is absorbed by plants and algae and is them converted
back to oxygen which we need to live. Most process that produce mechanical
movements and electrical energy convert fossil fuels to CO2 (carbon dioxide)
A very important and necessary part of live on this planets.
CH4= methane a part of natural gas used to heat homes, cook food and
run engines as cars, buses and trucks, etc. It is present in the ground
along with oil but is only present in the air (atmosphere) at very tiny
amounts. (part per billion) While millions of tons of this gas escape into
the atmosphere most of this is destroyed by interaction with Ozone (O3)
and UV a very active radiation present in sunlight. (this reaction is documented
by a paper in the EPA library) The Methane that is formed by bacteria is
almost everywhere. Its from swamps, rice paddies, bottom of oceans, lakes
and streams, decaying leaf piles etc. It is a part of natures process of
recycling.
NO2= a gas formed by nature when there is lightening. It is also formed
in any high temperature burning including engines. The gas is washed out
of the atmosphere in every rainstorm. It is used by plants, and is very
necessary for their growth.
To demonstrate if the greenhouse gas effect exists it is necessary
to define it.
The hypotheses of the greenhouse gas effect is the process where a
combination of IR absorbing gases including Water/vapor/liquid/solid, CO2.CH4.
NO2 and others are super insulation and cause the atmosphere to be 33 degrees
warmer than would be explained by the black body temperature A term developed
by a renowned physicist as a theoretical way to compare radiation. There
are only a few materials and conditions that approach these theoretical
properties. (The earth and its atmosphere is not one of them.).
How is this done? The hypothesis says that the IRags absorb the IR radiation
then it is back radiated to earth causing the earth to be warmer by the
resonating of this heat energy.
This is just the tip of the iceberg of the magic caused by the greenhouse
gas effect as has been said the truth is in the details therefore anyone
that wants to get into more of the details, please join in.
As others have not started to define The greenhouse gas effect lets
start with what are the features that should be testable! Because water/liquid,
vapor, solid (H2O /lvs) is different than gases IRags as CO2 ,CH4, NO2
and others gases - the IRags will be dealt with first.
Critical features:
The IRags absorb the IR radiation and thus prevent it from escaping into
space, reducing the rate of atmospheric cooling - it causes the air to
be warmer.
The IRags will back radiate IR radiation to earth to cause increased
heating of the surface.
The IRags will heat up by the absorption of the IR radiation thus heating
the air.
The IRag's have different levels of back-forcing. Thus CO2 is supposed
to be from 23 to 70 times more back radiation and CH4 (methane) is 1000
times that of CO2. Having asked others how this is determined, (no answer
yet), it is assumed that someone has reviewed the amount of IR that a particular
molecule absorbs by a IR spectrophotometer analysis then comparing this
to the absorption of CO2. (I have not seen any experimental data that the
back-forcing relates to absorption). This is a very important feature
of the ghg effect
The higher the concentration of IRags the greater the amount of back-radiation,
the higher the temperature of the Earth and global atmospheric temperature
will also increase.
The concentration of CO2 found in million year old Ice cores can be used
as proof that the ghg effect exists. When there is no experimental data
that proves that the ghg effect exists.
Where does this lead?
We all know that the greenhouse effect exist. Anyone that has gotten
into a hot car on a sunny day.(summer or winter). Has walked into a store
with south facing window, its temperature will be much higher than a car,
or window in the shade. This is caused by confined space heating - this
was established in 1909 by R.W. Wood a professor of Physics and Optics
at John Hopkins University from 1901 to 1955.
What experiment could be performed to prove that the ''greenhouse
gas effect exists.
All the AGW point out it is impossible to simulate what actually happens
in the atmosphere therefore they propose using computer models. The problem
with computer models'' is that unless all the factors that affect the
atmosphere are included into the program, it is garbage in garbage out.
When this is tried there are no computers made that have sufficient capacity
to handle all of the factors. Many of the factors are not even fully know
yet. Then the big guess is what are the factors to include and which are
really of minor importance and can be left out and still get usable results.
To date no one has come up with the right model. More than 20 different
models of weather /climate program have been published and not one has
been successful in predicting the weather a year from now, let alone a
hundred years from now.
Using the list of critical factor lets see if there are some ways
of indicating if the concept may exist.
To use the concentration of IRags in the atmosphere for testing does
not work, otherwise there would not be the controversy that exists today.
In the field of engineering and research there is the use of scale models
or models with similar factors that can be either up sized or down sized.
That are either similar in behavior or can be proportioned to a larger
or smaller series of events that relate to an actual set of events. That
generate data that can be compared to known conditions or events.
As the amount of heating that is supposed to be added by the greenhouse
gas effect is in the order of fractions of a degree per year - (some claim
the change to be 1 to 3 degrees/ year), we need a more dramatic experiment
to show that the concept actually exists. If the experiment at a much higher
concentration does demonstrate the effect then the concept does exist.
If the concept does work at high concentration then it can be tried with
lower and lower concentrations until a threshold of effects is reached.
However if the concept does not work at high concentrations of IRags then
the concept of the theoretical greenhouse gas effect has been proven
to be a fraud.
Some numbers are needed now: By definition 10,000 ppm is 1%, therefore
100 % equals 1 million parts per million (1x10+6) . Another way to put
it is if there are 1 million soldiers in the army and only one has a gun,
he better have a lot of bullets if he is going to defend the country. The
atmosphere is supposed to contain 400 ppm (round number) therefore a concentration
of 100% CO2 is 2500 times that of what is in the atmosphere. If the effect
exists it should be much easier to measure and demonstrate that back radiation
is causing a heating effect on the earth.
Now it is claimed that CH4 has from 23 to 70 times the effect of CO2,
thus using the lowers figure by using a concentration of 100 % CH4, the
effect should be 57500 times stronger that using CO2. It is claimed that
NO2 is 100 times more powerful that CO2 thus it should cause 250,000 times
the effect of CO2 in the atmosphere.
As CH4 is found to be about 2ppB (2E-9)in the atmosphere, a concentration
of 100 % CH4 should give a result that is 5 X 10 + 10 times what exists
in the atmosphere.
Now if CH4 has 23 times the effect of CO2 another longer chain hydrocarbon
molecule will be even more powerful thus the proposed experiment shown
below was done with 100 % butane.
The experiment shown below substituted natural gas a mixture of 70%
CH4 about 29% CO2 and the remainder is H2 and other trace gases. This is
readily available for test purposed from any natural gas stove. Now 100
% CO2 is available for several sources, but one that is not too expensive
is from any paint ball supply store, another is from a supplier of dry
ice. Do not use Alka Seltzer as you have to put this in water to get the
CO2 thus you have a mixture of CO2 and water and water vapor you are
not testing the effect of CO2 only. Discussion of H2O/lvs in the atmosphere
will follow later.
The natural gas mixture should have a combined effect of less that 100%
CH4 by a weighted average of 70% CH4+ 29% CO2or 3.500000725X10+9 times
the effect of CO2 in the atmosphere. If this occurs the temperature increase
must be measurable.
How does the experiment contain the high concentration of the IRags
for this test? Having reviewed several experiments that contained the IRags
is glass containers then they measures the increase in temperature of the
gas which had increased, they claimed this increase was due to the ghgeffect,
they are absolutely wrong. The cause of the temperature increase was due
to the heating of the glass by its absorbing the IR and the glass heating.
(A Master's thesis (peer reviewed) with this information is available on
request). Another failure of these tests were their including a black cardboard
inside the containers, thus additional heating of the IRags from conduction
of heat from the black cardboard. (They created a Greenhouse effect-confined
space heating)
The proper way to contain the high concentration of IRags is in a thin
walled material that will not absorb the IR and heat. The experiment used
crystal clear mylar balloons. They are available in various sizes, several
20 inch diameter (major diameter) were chosen. If you want you can use
larger ones to contain larger numbers of IRag molecules.
Now lets discuss the experiment.
1. Fill the balloons with the various IRags, and one with dry air as
a control.
2. Let the balloons reach ambient temperature. If you are going to
use sunlight let it adjust outside in the shade.
3. Use an IR thermometer to check the temperatures of each balloon,
use a digital thermometer that reads to 0.1 degree to check air temperature
in the shade. Record data.
4. Take a large black matte board or a large black cloth or sheet and
lay it on the ground in the sun. Use the IR thermometer to check the temperature
as it rises in the sun. Record the data. When it appears to reach a maximum
then go to step 5.
5. Suspend the balloons over the black background (about 1 foot above)
and measure the temperature of the balloons initially. Record the temperature.
6. Measure the temperature of the black background in the shadow
of each of the balloons; also measure the temperature of the black background
outside of the shadows of the balloons.
Now lets repeat the Critical factors and note the result of my test
to the critical factor.
Critical features:
1. The IRags absorb the IR radiation and thus prevent it from escaping
into space reducing the rate of atmospheric cool - it causes the air to
be warmer. The air between the balloons and the black background did not
change temperature.
2. The IRags will back radiate IR radiation to earth to cause increased
heating of the surface. The black background did not change temperature
either in the shadow or outside the shadow. The temperature of the black
background heated to 20 t0 30 degrees above ambient before the balloons
were placed over the black background. When this was done outside in bright
sun light the black background heated to 130 to 140 degrees F. Similar
temperature can be measured from black asphalt. When the experiment was
done with the 500 watt power shop light (see below) inside the black background
went from ambient of 70-72 degrees to 100 -110 degrees. Again when measuring
the temperatures of the black background with the IR thermometer there
was no measurable temperature difference anywhere along the surface.
3. The IRags will heat up by the absorption of the IR radiation thus
heating the air. The balloons did not become any warmer than ambient. The
IRags in the balloons will not warm because that would be a violation of
the Bohr Model.
4. The IRags have different levels of back-forcing. Having asked
others how this is determined, (no answer yet), it is assumed that someone
has reviewed the amount of IR that a particular molecule absorbs by a spectrophotometer
analysis then comparing this to the absorption of CO2. (I have not seen
any experimental data that the back-forcing relates to absorption). (an
assumption based on The Bohr model however a time factor is needed). As
there was no temperature difference under any of the balloons, there was
no stronger back-forcing because the IRag absorbed more IR radiation.
5. The higher the concentration of IRags the greater the amount of
back-radiation the higher the global atmospheric temperature will become.
(were is the experimental data )
6. The concentration of CO2 found in million year old Ice cores can
be used as proof that the ghg effect exists. When there is no experimental
data that proves that the ghg effectexists.
Specifications of the IR thermometer: model: MTPRO laser-Micro
Temp; temperature range: -41degree C/F to 1040 degrees F. IR range 5 to
16 nm. Angle of view D:S =11:1 cost about $60.00. many other models available.
I have thought about several refinements, but it would not change the
bottom line that the ghg effect is a fairy-tale.
I'm sure that the AGW's will not believe this proves that the greenhouse
gas effect does not exists , therefore I challenge them to come up with
an experiment that they claim proves the existence of the greenhouse
gas effect.
As an alternate light source the experiment has been performed with
an incandescent light. By using a 500 watt shop power light which because
of the temperature of the filament approach the spectral characteristics
of the Sun light ( should have more long wave IR because of a lower temperature)
It was place one(1) meter away from the balloons to avoid conduction and
convection heating of the balloons. As is stated above there was no difference
in the final results.
Now lets talk about water( H2O/lvs):
Yes H2O/lvs has a major effect on weather conditions, where I'm at in
Northern Ohio it just started to rain, if it gets any colder we will have
snow or sleet. Of course tomorrow it may be sunny and clear. As is said
in the Great Lakes region if you don't like the weather wait 15 minutes
and it will change. Now the climate has not changed for the last 300
years just ask the Indians.
Any way lets look a H2O/lvs in the atmosphere : If its clear the humidity
can be from near 0 % relative humidity to 100%. Now if it 's cloudy the
relative Humidity can vary from 30 to 100% depending on temperatures.
Now we know that the air temperature where the clouds are forming is at
or below the dew point, now as the H2O vapor cools to form clouds there
is a release of energy (heat of condensation), if the general air temperature
is low enough (below freezing) more energy is released as ice or snow is
formed. This energy has to be dissipated either as IR radiation or as lightning
or probably high winds or tornado.
This is only one phase of the complex weather conditions when H2O/lvs
is being evaluated another is the solar heating of clouds both day and
night. During the day the warming of the top of clouds is obvious but it
is also relevant that in spite of significant solar absorption the clouds
have not absorbed enough radiation to convert the water or solids back
to vapor; there is probably a rapid turbulent exchange of energy in both
directions from evaporation/ sublimation to condensing, to freezing. This
is why climatologists can not get the correct sign on the forcing,
as it is a constantly changing set of conditions, none are wrong and none
are correct.
Now lets add the next variable - solar heating at night of the clouds.
Having taken IR radiation measurements at night for the last year at many
different times by solar time it is apparent that when the sun goes down
below the visible horizon, the clouds are still receiving solar energy.
This has been confirmed by both measurements and visible lighting (multiple
colors) of the clouds. The clouds and the atmosphere cool until about 2:00
am when there is measurable increases in cloud temperatures and air temperatures.
This warming continues until daylight is visible. The degree of warming
is related to the time of year and what is happening with the jet stream
and arctic storms.
There are other factors that are being monitored by real astrophysics
researcher that are showing that Solar flares, and different type of radiation
have an effect on cloud formation,this is only a beginning of learning
about our atmosphere.
There is no way in the world of fairy-tales that CO2 can have an effect
on weather or climate.
The nice thing about this experiment is that it can be done by high
school physics classes or freshmen college physics lab classes . It would
teach a very important lesson in that not all experiments have to have
a positive end result to be meaningful.
Mann-made global warming is a hoax,because the greenhouse gas effect
is a fairy -tale.
Berthold Klein P.E.
November 19, 2010
List of references:
The paper "Falsification of the Atmospheric CO2 greenhouse effect within
the frame of physics" by Gerhard Gerlich and Ralf D. Tscheuschner is an
in-depth examination of the subject. Version 4 2009
Electronic version of an article published as International Journal
of Modern Physics B, Vol. 23, No. 3 (2009) 275{364 , DOI No: 10.1142/S021797920904984X,
c World Scientific Publishing Company, http://www.worldscinet.com/ijmpb.
Report of Alan Carlin of US-EPA March, 2009 that shows that CO2 does
not cause global warming.
Greenhouse Gas Hypothesis Violates Fundamentals of Physics by Dipl-Ing
Heinz Thieme This work has about 10 or 12 link
that support the truth that the greenhouse gas effect is a hoax.
R.W.Wood from the London, Edinborough and Dublin Philosophical Magazine
, 1909, vol 17, p319-320. Cambridge UL shelf mark p340.1.c.95, i
The Hidden Flaw in Greenhouse Theory By Alan Siddons from: http://www.americanthinker.com/2010/02/the_hidden_flaw_in_greenhouse.html
at March 01, 2010 - 09:10:34 AM CST
The below information was a foot note in the IPCC 4 edition. It is obvious
that there was no evidence to prove that the ghg effect exists.
In the 1860s, physicist John Tyndall recognized the Earth's natural
greenhouse effect and suggested that slight changes in the atmospheric
composition could bring about climatic variations. In 1896, a seminal paper
by Swedish scientist Svante Arrhenius first speculated that changes in
the levels of carbon dioxide in the atmosphere could substantially alter
the surface temperature through the greenhouse effect.
After 1909 when R.W.Wood proved that the understanding of the greenhouse
effect was in error and that the ghg effect does not exist. After that,
Niels Bohr published his work and received a Nobel Prize in Physics in
1922. The fantasy of the greenhouse gas effect should have died in 1909
and 1922. Since then it has been shown by several physicists that the concept
is a violation of the Second Law of Thermodynamics.
Obviously the politicians dont give a dam that they are lying. It fits
in with what they do every hour of every day .Especially the current pretend
president.
Paraphrasing Albert Einstein after the Publishing of The Theory of
Relativity one fact out-does 1 million scientist, 10 billion politicians
and 20 billion environmental whachos-that dont know what The Second Law
of thermodynamics is.
University of Pennsylvania Law School ILE, INSTITUTE FOR LAW AND ECONOMICS
A Joint Research Center of the Law School, the Wharton School, and
the Department of Economics in the School of Arts and Sciences at the University
of Pennsylvania
RESEARCH PAPER NO. 10-08 Global Warming Advocacy Science: a Cross
Examination, Jason Scott Johnston, UNIVERSITY OF PENNSYLVANIA, May
2010
This paper can be downloaded without charge from the Social Science
Research Network Electronic Paper Collection:
http://ssrn.
Israeli Astrophysicist Nir Shaviv: 'There is no direct evidence
showing that CO2 caused 20th century warming, or as a matter of fact, any
warming' link to this paper on climate depot.
Slaying the Sky Dragon - Death of the Greenhouse Gas Theory
[Kindle Edition] by Tim Ball, Claes Johnson, Martin Hertzberg, Joseph A.
Olson, Alan Siddons, Charles Anderson, Hans Schreuder, John O'Sullivan.
Web- site references:
www.americanthinker.com Ponder the Maunder
wwwclimatedepot.com
icecap.us
www.stratus-sphere.com
SPPI
The Great Climate Clash -archives December, 2010 , G3 The greenhouse
gas effect does not exist.( not yet peer reviewed).
many others are available.
The bottom line is that the facts show that the greenhouse gas effect
is a fairy-tale and that man-made global warming is the World's larges
Scam!!! The IPCC and Al Gore should be charged under the US Anti-racketeering
act and when convicted, they should spend the rest of their lives
in jail for the Crimes they have committed against Humanity.
"The only thing more dangerous than ignorance
is arrogance." Albert Einstein
"Democracy is two wolves and a lamb
deciding what to have for dinner. Liberty is a well-armed lamb."
- Benjamin Franklin
Ralf Tscheuschner hits the nail on the
head by stating boldly:
"Orthodox global warming science fails:
Ignoring scientific data that is contrary to the
central conclusions.
Failure to rigorously test hypotheses using physical
observations.
Assuming results are evidence of cause.
Assuming a poor correlation is evidence of cause.
Assuming a thorough knowledge of the climate system.
Assuming that calculations involving variables
with a low level of understanding can produce results embodying a high
level of understanding.
Assuming projections from unverified models are
scientific knowledge.
Not considering the history before 50 years ago"
Follow-up
Report on Corruption of Surface Temperture Records By Joseph D'Aleo and Anthony Watts
January 23, 2010
"Authors veteran meteorologists Joe dAleo and Anthony Watts analyzed
temperature records from all around the world for a major SPPI paper, Surface
Temperature Records Policy-driven Deception? The startling conclusion
that we cannot tell whether there was any significant global warming
at all in the 20th century is based on numerous astonishing examples of
manipulation and exaggeration of the true level and rate of global warming.
From a Report by the TV Station KUSI:
"Skeptical climate researchers have discovered extensive manipulation
of the data within the U.S. Government's two primary climate centers: the
National Climate Data Center (NCDC) in Asheville, North Carolina and the
NASA Goddard Institute for Space Studies (GISS) at Columbia University
in New York City. These centers are being accused of creating a strong
bias toward warmer temperatures through a system that dramatically trimmed
the number and cherry-picked the locations of weather observation stations
they use to produce the data set on which temperature record reports are
based."
(Alternative)
Summary for Policy Makers: (found at Heliogenic Climate Change)
Instrumental temperature data for the pre-satellite era (1850-1980) have
been so widely, systematically, and unidirectionally tampered with that
it cannot be credibly asserted there has been any significant global warming
in the 20th century.
All terrestrial surface-temperature databases exhibit very serious problems
that render them useless for determining accurate long-term temperature
trends.
All of the problems have skewed the data so as greatly to overstate observed
warming both regionally and globally.
Global terrestrial temperature data are gravely compromised because more
than three-quarters of the 6,000 stations that once existed are no longer
reporting.
There has been a severe bias towards removing higher-altitude, higher-latitude,
and rural stations, leading to a further serious overstatement of warming.
Contamination by urbanization, changes in land use, improper siting, and
inadequately-calibrated instrument upgrades further overstates warming.
Numerous peer-reviewed papers in recent years have shown the overstatement
of observed longer term warming is 30-50% from heat-island contamination
alone.
Cherry-picking of observing sites combined with interpolation to vacant
data grids may make heat-island bias greater than 50% of 20th-century warming.
In the oceans, data are missing and uncertainties are substantial. Comprehensive
coverage has only been available since 2003, and shows no warming.
Satellite temperature monitoring has provided an alternative to terrestrial
stations in compiling the global lower-troposphere temperature record.
Their findings are increasingly diverging from the station-based constructions
in a manner consistent with evidence of a warm bias in the surface temperature
record.
NOAA and NASA, along with CRU, were the driving forces behind the systematic
hyping of 20th-century global warming.
Changes have been made to alter the historical record to mask cyclical
changes that could be readily explained by natural factors like multidecadal
ocean and solar changes.
Global terrestrial data bases are seriously flawed and can no longer be
trusted to assess climate trends or VALIDATE model forecasts.
An inclusive external assessment is essential of the surface temperature
record of CRU, GISS and NCDC chaired and paneled by mutually agreed to
climate scientists who do not have a vested interest in the outcome of
the evaluations.
Reliance on the global data by both the UNIPCC and the US GCRP/CCSP also
requires a full investigation and audit.
Full Report at Science and Public Policy Org http://scienceandpublicpolicy.org/originals/policy_driven_deception.html
Among some of the facts that came out: These Scientists urged each other
'to present a "unified" view on their theory of man-made climate change,
calling it an important "common cause." They also advised each other on
how to adjust data so it wouldn't compromise their hypothesis, discussed
ways to keep opposing views out of leading Science journals, and
gave tips on how to "hide the decline" of temperature in certain inconvenient
data.
http://scienceandpublicpolicy.org/images/stories/papers/originals/surface_temp.pdf
- Joseph DAleo and Anthony Watts (2010): Surface temperature records:
policy-driven deception? (200 pages) "..so much fiddling and dishonesty
have been going on that it is impossible to say whether warming has occurred
at all". Surface temperature recordings are in a terrible mess. Important
read.
NASA's
predictions of solar cycle 24 The following is a compilation of NASAs solar prediction/observation
press releases over the last 7 years. Those before 2009 are nothing short
of awful, but there appears to have been some improvement (a decrease in
wild speculation and sensationalism) since 2009:
Nov 12, 2003: The Sun Goes Haywire Solar maximum is years past, yet
the sun has been remarkably active lately. Is the sunspot cycle broken?
http://science.nasa.gov/headlines/y2003/12nov_haywire.htm
Oct 18, 2004: Something strange happened on the sun last week: all the
sunspots vanished. This is a sign, say scientists, that solar minimum is
coming sooner than expected. http://science.nasa.gov/headlines/y2004/18oct_solarminimum.htm
May 5, 2005: Solar Myth With solar minimum near, the sun continues to
be surprisingly active. http://science.nasa.gov/headlines/y2005/05may_solarmyth.htm
Sept 15, 2005: Solar Minimum Explodes Solar minimum is looking strangely
like Solar Max. http://science.nasa.gov/headlines/y2005/15sep_solarminexplodes.htm
Aug 15th, 2006: Backward Sunspot A strange little sunspot may herald
the coming of one of the stormiest solar cycles in decades. http://science.nasa.gov/headlines/y2006/15aug_backwards.htm
Dec 21, 2006 Scientists Predict Big Solar Cycle Evidence is mounting:
the next solar cycle is going to be a big one. http://science.nasa.gov/headlines/y2006/21dec_cycle24.htm
Dec 14, 2007 Is a New Solar Cycle Beginning? The solar physics community
is abuzz this week. http://science.nasa.gov/headlines/y2007/14dec_excitement.htm
Jan 10, 2008: Solar Cycle 24 Hang on to your cell phone, a new solar
cycle has just begun. http://science.nasa.gov/headlines/y2008/10jan_solarcycle24.htm
March 28, 2008: Old Solar Cycle Returns Barely three months after forecasters
announced the beginning of new Solar Cycle 24, old Solar Cycle 23 has returned.
http://science.nasa.gov/headlines/y2008/28mar_oldcycle.htm
July 11, 2008: Whats Wrong with the Sun? (Nothing) Stop the presses!
The sun is behaving normally. http://science.nasa.gov/headlines/y2008/11jul_solarcycleupdate.htm
Sept. 30, 2008: Spotless Sun: Blankest Year of the Space Age - Sunspot
counts are at a 50-year low Were experiencing a deep minimum of the
solar cycle. http://science.nasa.gov/headlines/y2008/30sep_blankyear.htm
Nov. 7, 2008: The Sun Shows Signs of Life I think solar minimum is behind
us http://science.nasa.gov/headlines/y2008/07nov_signsoflife.htm
April 1, 2009: Deep Solar Minimum Were experiencing a very deep solar
minimum This is the quietest sun weve seen in almost a century http://science.nasa.gov/headlines/y2009/01apr_deepsolarminimum.htm
May 29, 2009: If our prediction is correct, Solar Cycle 24 will have a
peak sunspot number of 90, the lowest of any cycle since 1928 when Solar
Cycle 16 peaked at 78, http://science.nasa.gov/headlines/y2009/29may_noaaprediction.htm
June 17, 2009: Mystery of the Missing Sunspots, Solved? The sun is in
the pits of a century-class solar minimum, and sunspots have been puzzlingly
scarce for more than two years. http://science.nasa.gov/headlines/y2009/17jun_jetstream.htm
September 3, 2009: Are Sunspots Disappearing? The sun is in the pits
of the deepest solar minimum in nearly a century. Weeks and sometimes whole
months go by without even a single tiny sunspot. The quiet has dragged
out for more than two years, prompting some observers to wonder, are sunspots
disappearing? http://science.nasa.gov/headlines/y2009/03sep_sunspots.htm
September 29, 2009 Cosmic Rays Hit Space Age High In 2009, cosmic ray
intensities have increased 19% beyond anything weve seen in the past 50
years, says Richard Mewaldt of Caltech. The increase is significant,
and it could mean we need to re-think how much radiation shielding astronauts
take with them on deep-space missions. http://science.nasa.gov/headlines/y2009/29sep_cosmicrays.htm
March 12, 2010 NASA Solar Current of Fire Speeds Up the top of the
suns Great Conveyor Belt has been running at record-high speeds for the
past five years. http://science.nasa.gov/science-news/science-at-nasa/2010/12mar_conveyorbelt/
July 15, 2010 A Puzzling Collapse of Earths Upper Atmosphere This is
the biggest contraction of the thermosphere in at least 43 years http://science.nasa.gov/science-news/science-at-nasa/2010/15jul_thermosphere/
Dec. 13, 2010: Global Eruption Rocks the Sun A global eruption on the
sun has shattered old ideas about solar activity. http://science.nasa.gov/science-news/science-at-nasa/2010/13dec_globaleruption/
My question to NASA, is the sun still behaving normally and what
exactly is normal behavior for a 4.6 Billion year-old G-type Main Sequence
Star?
Japan's
boffins: Global warming isn't man-made Climate science is 'ancient
astrology', claims report By Andrew Orlowski
Posted in Environment, 25th February 2009 12:23 GMT
http://www.theregister.co.uk/2009/02/25/jstor_climate_report_translation/ [note: boffins are technical experts; persons engaged in (military)
scientific research]
Exclusive Japanese scientists have made a dramatic break with the UN
and Western-backed hypothesis of climate change in a new report from its
Energy Commission.
Three of the five researchers disagree with the UN's IPCC view that
recent warming is primarily the consequence of man-made industrial emissions
of greenhouse gases. Remarkably, the subtle and nuanced language typical
in such reports has been set aside.
Click here to find out more!
One of the five contributors compares computer climate modelling to
ancient astrology. Others castigate the paucity of the US ground temperature
data set used to support the hypothesis, and declare that the unambiguous
warming trend from the mid-part of the 20th Century has ceased.
The report by Japan Society of Energy and Resources (JSER) is astonishing
rebuke to international pressure, and a vote of confidence in Japan's native
marine and astronomical research. Publicly-funded science in the West uniformly
backs the hypothesis that industrial influence is primarily responsible
for climate change, although fissures have appeared recently. Only one
of the five top Japanese scientists commissioned here concurs with the
man-made global warming hypothesis.
JSER is the academic society representing scientists from the energy
and resource fields, and acts as a government advisory panel. The report
appeared last month but has received curiously little attention. So The
Register commissioned a translation of the document - the first to appear
in the West in any form. Below you'll find some of the key findings - but
first, a summary.
Summary
Three of the five leading scientists contend that recent climate change
is driven by natural cycles, not human industrial activity, as political
activists argue.
Kanya Kusano is Program Director and Group Leader for the Earth Simulator
at the Japan Agency for Marine-Earth Science & Technology (JAMSTEC).
He focuses on the immaturity of simulation work cited in support of the
theory of anthropogenic climate change. Using undiplomatic language, Kusano
compares them to ancient astrology. After listing many faults, and the
IPCC's own conclusion that natural causes of climate are poorly understood,
Kusano concludes:
"[The IPCC's] conclusion that from now on atmospheric temperatures are
likely to show a continuous, monotonic increase, should be perceived as
an unprovable hypothesis," he writes.
Shunichi Akasofu, head of the International Arctic Research Center in
Alaska, has expressed criticism of the theory before. Akasofu uses historical
data to challenge the claim that very recent temperatures represent an
anomaly:
"We should be cautious, IPCC's theory that atmospheric temperature has
risen since 2000 in correspondence with CO2 is nothing but a hypothesis.
"
Akasofu calls the post-2000 warming trend hypothetical. His harshest
words are reserved for advocates who give conjecture the authority of fact.
"Before anyone noticed, this hypothesis has been substituted for truth...
The opinion that great disaster will really happen must be broken."
Key Passages Translated What is the source of the rise
in atmospheric temperature in the second half of the 20th century?
Shunichi Akasofu [Founding Director of the International Arctic Research
Center of the University of Alaska Fairbanks (UAF)
Introductory discussion. Point 1.1: Global Warming has halted
Global mean temperature rose continuously from 1800-1850. The rate of
increase was .05 degrees Celsius per 100 years. This was mostly unrelated
to CO2 gas (CO2 began to increase suddenly after 1946. Until the sudden
increase, the CO2 emissions rate had been almost unchanged for 100 years).
However, since 2001, this increase halted. Despite this, CO2 emissions
are still increasing.
According to the IPCC panel, global atmospheric temperatures should
continue to rise, so it is very likely that the hypothesis that the majority
of global warming can be ascribed to the Greenhouse Effect is mistaken.
There is no prediction of this halt in global warming in IPCC simulations.
The halt of the increase in temperature, and slight downward trend is "something
greater than the Greenhouse Effect," but it is in effect. What that "something"
is, is natural variability.
From this author's research into natural (CO2 emissions unrelated to
human activity) climate change over the past 1000 years, it can be asserted
that the global temperature increase up to today is primarily recovery
from the "Little Ice Age" earth experienced from 1400 through 1800 (i.e.
global warming rate of change?0.5?/100).
The recovery in temperatures since follows a naturally variable 30-50
year cycle, (quasi-periodic variations), and in addition, this cycle has
been positive since 1975, and peaked in the year 2000. This quasi-periodic
cycle has passed its peak and has begun to turn negative.
(The IPCC ascribes the positive change since 1975, for the most part,
to CO2 and the Greenhouse Effect.) This quasi-periodic cycle fluctuates
0.1 degrees C per 10 years, short term (on the order of 50 years). This
quasi-periodic cycle's amplitude is extremely pronounced in the Arctic
Circle , so it is easy to understand. The previous quasi-periodic cycle
was positive from 1910 to 1940 and negative from 1940 to 1975 (despite
CO2 emissions rapid increase after 1946).
Regardless of whether or not the IPCC has sufficiently researched natural
variations, they claim that CO2 has increased particularly since 1975.
Consequently, after 2000, although it should have continued to rise, atmospheric
temperature stabilised completely (despite CO2 emissions continuing to
increase). Since 1975 the chances of increase in natural variability (mainly
quasiperiodic vibration) are high; moreover, the quasiperiodic vibration
has turned negative. For that reason, in 2000 Global Warming stopped, after
that, the negative cycle will probably continue.
Regarding the current temporary condition (la Nina) JPL observes a fluctuation
of the quasiperiodic cycle [JSER editor's note: this book is is still being
proofed as of 12/19]. So we should be cautious, IPCC's theory that atmospheric
temperature has risen since 2000 in correspondence with CO2 is nothing
but a hypothesis.
They should have verified this hypothesis by supercomputer, but before
anyone noticed, this hypothesis has been substituted for "truth". This
truth is not observationally accurate testimony. This is sidestepping of
global warming theory with quick and easy answers, so the opinion that
a great disaster will really happen must be broken.
It seems that global warming and the halting of the temperature rise
are related to solar activity. Currently, the sun is "hibernating". The
end of Sunspot Cycle 23 is already two years late: the cycle should have
started in 2007, yet in January 2008 only one sunspot appeared in the sun's
northern hemisphere, after that, they vanished completely (new sunspots
have now begun to appear in the northern hemisphere). At the current time,
it can clearly be seen there are no spots in the photosphere. Lately, solar
winds are at their lowest levels in 50 years. Cycle 24 is overdue, and
this is is worrisome.
So, have there been other historical periods with an absence of sunspots?
As a matter of fact, from 1650 to 1700 approximately, there were almost
no sunspots. This time period has been named for the renown English astronomer
Maunder, and is called the Maunder Minimum.
There is a relationship between transported energy and the light emissions
from the photosphere and sunspots. It was thought that times of few sunspots
are times of lower energy. Satellites were launched in 1980 to research
this, and results were contrary to expectations. It became clear that these
times were more energetic than periods of high sunspots. Periods of low
sunspots have vigorous solar activity. The total change during sunspot
cycles is usually .0.1%, from the Maunder Minimum to today the increase
is .05%. The Maunder Minimum fell in the middle of the period of 1400-1800,
the Little Ice Age, and it was theorized that this was due to a cut in
solar emissions. The theory is that solar activity began to increase after
that, and from 1800 global warming increased and recovery from the Little
Ice Age began.
But sunspot change and climate change are not clearly correlated. Rather,
the cycle was not the punctual 11 years, scientific research indicates
that climate change is related to that change. Furthermore, according to
the IPCC's computational investigation, this energy increase does not significantly
contribute to global warming. But then, the IPCC insists that current global
warming correlates to CO2, solar influence is estimated as minimal, this
calculation should be redone. This 0.1-0.5% is an enormous sum of energy.
The energy of solar emissions is not just light from the photosphere. Solar
winds cause geomagnetic storms, yet comparisons of solar wind and light
energy to particle emissions are rarely carried out. Research into the
relationship between geomagnetic storms and climate change has been undertaken
for almost 100 years. However, because during this time, this simple correlation
has not been seen, no conclusion has been reached. The super-hot temperatures
of geomagnetic storms higher than 100 kilometers have increased, and the
chances of the stratospheric and tropospheric transference are low.
Through the 11 year sunspot cycle, ultraviolet rays vary considerably,
the ionosphere and ozone layer are affected. Whether or not this affects
the troposphere is unknown. More research is necessary. On the other hand,
cosmic rays continuously fall, it seems that they constantly seed comparatively
low clouds. The solar system may shield us somewhat from Geomagnetic storms
caused by solar winds, so called "magnetic clouds" may shield us from extrasolar
cosmic rays, so solar activity and climate are in a complex relationship.
In this way, climate change and solar activity's relationship is inconclusive.
It is necessary to increase research efforts into the relationship between
Earth's climate fluctuations and solar activity.
Predicting the Future with Numerical
Simulation Kanya Kusano, Japan Agency for Marine-Earth Science & Technology
(JAMSTEC)
Numerical simulation by forecast models are generally classified as
theoretical models and empirical models. The former follows universal laws
and carries out predictive calculations, the latter makes models that are
thought to be realistic from data of phenomenon. These two methods cannot
be strictly differentiated, generally experiential methods gradually become
theoretical methods, finally becoming the generally accepted dogma.
Celestial mechanics originated in astrological prediction of solar and
lunar eclipses, calendars were experiential predictions; mechanistic theory
evolved when we reached an era of accurate computation. Consequently, the
predictability of celestial mechanics became extremely high and practical
estimates gave way to proof. Similarly, modern Global Climate Models still
largely dependent on empirical models. Fundamental principles, therefore
must resolve very complex physical/chemical/biological processes and phenomenon.
That is why many artificial optimization operations (parameterization tuning)
are needed, or we will not be able to reproduce the phenomenon. Because
of this, besides mathematical accuracy, the people who construct models'
choice of processes and optimum operating guidelines will have large scale
effects on the calculated results.
1. Scientific Understanding and Uncertainty When constructing models, if our scientific understanding is poor,
we are not able to capture the model. But we should pay attention to the
importance of the naturally occurring processes when our scientific understanding
is not yet clearly decided.
In the IPCC's 4th Evaluation Report, a few potentially major processes
were discussed; but [since] scientific understanding was too low to decide,
the evaluation of these was omitted. In order to scientifically understand
the uncertainty of accurate estimates according to the potential importance
of these processes, "the cause of lack of scientific understanding and
uncertainty" must be assessed.
Finally, uncertainty estimates should be included. For example, the
effect of variances in cosmic ray activity on clouds, caused by sunspot
activity, solar flares accompanied by energetic protons striking the upper
atmosphere and generating NOx and ozone effects [*], etc., are not sufficiently
understood and incorporated into the models.
Also, there are great uncertainties in reproducing historical TSI (Total
Solar Irradiance), TSI fluctuation and spectral change related climate
sensitivity estimates are inadequate.
2. The limits of modeling aerosols and clouds The indirect effect of aerosols and aerosol generation as the greatest
uncertainty is becoming widely recognized, but fundamental, naturally spontaneous
(especially oceanic) aerosols are not yet well understood. Dimethyl sulfide
(DMS: CH3SCH3) of biological origin is thought to be a primary source of
sulphuric aerosol formation over oceans, but the process of cloud cores
forming from DMS is not sufficiently understood. According to recent physical
models, the percentage of involvement of cosmic ray ionization processes
is not well understood.
Furthermore, the types of aerosols and the ways they affect climate
systems are not well understood. The increasing number of aerosols, in
this case, augments precipitation, but if it increases too much, water
droplet diameter will decrease and cloud generation will be renewed, and
the albedo will be changed significantly. Thus, the fine-scale physical
processes of clouds causing feedback in geological climate fluctuation
now clearly points at this as a decisively material effect.
However, the discussion of the properties and life span of aerosols
in clouds in the IPCC 4th Evaluation Report is inadequate.
3. Predictability and estimation rules The 4th Evaluation Report is confident of the reliability of its assessment
that previous data does not differ from its model. But a more effectively
persuasive assessment of its predictive ability has not come forth. This
is like the ancient Greek Thales predicting solar eclipses, future predictions
should be tested in practice. Again, by means of short metaphase models
and domain models, future information feedback can be isolated in hindcast
experiments (reproducing the past according to the model) and quantitatively
compared to long term climate predictions assessments.
4. Conclusion: Anthropogenic global warming theory still hypothetical To summarize the discussion so far, compared to accurately predicting
solar eclipses by celestial mechanics theoretical models, climate models
are still in the phase of reliance on trial and error experiential models.
There are still no successful precedents. The significance of this is that
climate change theory is still dominated by anthropogenic greenhouse gas
causation; the IPCC 4th Evaluation Report's conclusion that from now on
atmospheric temperatures are likely to continuously, monotonously increase,
should be perceived as an unprovable hypothesis; it will be necessary investigate
further and to evaluate future predictions as subject to natural variability.
®
I am often amused by claims that we understand Earths climate system,
are able to accurately measure its behavior, eliminate all potential variables
except CO2 as the primary driver of Earths temperature and make predictions
of Earths temperature decades into the future, all with a high degree
of confidence. I have been studying Earths climate system for several
years and have found it to be a ridiculously complex, continually evolving
and sometimes chaotic beast. Furthermore, our understanding of Earths
climate system is currently rudimentary at best, our measurement capabilities
are limited and our historical record is laughably brief. To help demonstrate
the complexity of Earths climate system I have been compiling a list of
all of the variables potentially involved in Earths climate system. This
is a work in progress so additions, recommendations, corrections, questions
etc. are most welcome. Once I develop this further and polish it up a bit
I plan to convert it into a new WUWT Reference Page.
and Polar Vortices; http://en.wikipedia.org/wiki/Polar_vortex
which are caused when an area of low pressure sits at the rotation
pole of a planet. This causes air to spiral down from higher in the atmosphere,
like water going down a drain.
http://www.universetoday.com/973/what-venus-and-saturn-have-in-common/
Heres an animation of the Arctic Polar Vortex in Winter 2008 09;
http://www.youtube.com/watch?v=mIXfYTSmBg0&feature=player_embedded
Earths Rotational Energy drives Plate Tectonics;
By analyzing the minute changes in travel times and wave shapes for
each doublet, the researchers concluded that the Earths inner core is
rotating faster than its surface by about 0.3-0.5 degrees per year. That
may not seem like much, but its very fast compared to the movement of
the Earths crust, which generally slips around only a few centimeters
per year compared to the mantle below, said Xiaodong Song, a geologist
at the University of Illinois at Urbana-Champaign and an author on the
study.
The surface movement is called plate tectonics. It involves the shifting
of about a dozen major plates and is what causes most earthquakes. which
result in Earthquakes;
most Volcanoes; http://en.wikipedia.org/wiki/Volcano
and Mountain Formation; http://en.wikipedia.org/wiki/Mountain_formation
which can influence the creation of Atmospheric Waves: http://en.wikipedia.org/wiki/Atmospheric_wave
Plate Tectonics also drive Wilson Cycles; http://csmres.jmu.edu/geollab/fichter/Wilson/Wilson.html
Cycles of ocean basin growth and destruction, known as Wilson cycles,
involving continental rifting, seafloor-spreading, subduction, and collision.;
Climate change on ultra-long time scales (tens of millions of years) are
more than likely connected to plate tectonics.
Through the course of a Wilson cycle continents collide and split
apart, mountains are uplifted and eroded, and ocean basins open and close.
The re-distribution and changing size and elevation of continental land
masses may have caused climate change on long time scales.
http://www.pbs.org/wgbh/nova/ice/chill.html
and the Supercontinent Cycle: http://en.wikipedia.org/wiki/Supercontinent_cycle
Lastly, Rotational Energy is the primary driver of Earths Dynamo; http://en.wikipedia.org/wiki/Dynamo_theory
which generates Earths Magnetic Field; http://en.wikipedia.org/wiki/Earth%27s_magnetic_field
and accounts for the Earthy behaviors of Magnetosphere: http://en.wikipedia.org/wiki/Magnetosphere
2. Earths Orbital Energy, Elliptical Orbit around the Sun (Eccentricity),
Tilt (Obliquity) and Wobble (Axial precession): http://en.wikipedia.org/wiki/Specific_orbital_energy
http://www.physicalgeography.net/fundamentals/6h.html
The gravity of the Moon and Sun, Earths rotation, Earths orbit around
the Sun, Earths tilt, Earths wobble and the Moons orbit around Earth
act in concert to determine the constantly evolving Tidal Force on Earth:
http://en.wikipedia.org/wiki/Tidal_force
This tidal force results in that result in Earths Ocean Tide; http://en.wikipedia.org/wiki/Tide
http://www.themcdonalds.net/richard/astro/papers/602-tides-web.pdf
in concert with Tidal Forces, influence Earths Ocean Circulation;
which influences Oceanic Oscillations including El Nino/La Nina; http://en.wikipedia.org/wiki/El_Ni%C3%B1o-Southern_Oscillation
the Pacific Decadal Oscillation (PDO); http://en.wikipedia.org/wiki/Pacific_Decadal_Oscillation
the Atlantic Multi-Decadal Oscillation (AMO) and; http://en.wikipedia.org/wiki/Atlantic_Multidecadal_Oscillation
the Indian_Ocean_Dipole (IOD)/Indian Ocean Oscillation (IOO); http://en.wikipedia.org/wiki/Indian_Ocean_Dipole
and Geostrophic Wind: http://en.wikipedia.org/wiki/Geostrophic_wind
are examples of inertial waves. Inertial waves are also likely to exist
in the core of the Earth
4. Solar Energy; http://en.wikipedia.org/wiki/Solar_energy
results is Solar Radiation/Sunlight; http://en.wikipedia.org/wiki/Solar_radiation
which varies based upon 11 and 22 year cycles: http://en.wikipedia.org/wiki/Solar_cycle
Total Solar Irradiance (TSI); http://www.ngdc.noaa.gov/stp/solar/solarirrad.html
appears to fluctuate by approximately 0.1% or about 1.3 Watts per square
meter (W/m2) peak-to-trough during the 11-year sunspot cycle: http://en.wikipedia.org/wiki/Solar_variation
Solar Energy also drives the Hydrological/Water Cycle: http://en.wikipedia.org/wiki/Hydrological_cycle
as Total Solar Irradiance (TSI) causes evaporation; http://en.wikipedia.org/wiki/Evaporation
that drives cloud formation; http://en.wikipedia.org/wiki/Cloud
results in precipitation; http://en.wikipedia.org/wiki/Precipitation_%28meteorology%29
that results in the Water Distribution on Earth; http://en.wikipedia.org/wiki/Water_distribution_on_Earth
which result in rivers; http://en.wikipedia.org/wiki/River
and drives erosion: http://en.wikipedia.org/wiki/Erosion
Solar energy is also The driving force behind atmospheric circulation
is solar energy, which heats the atmosphere with different intensities
at the equator, the middle latitudes, and the poles.: http://www.scienceclarified.com/As-Bi/Atmospheric-Circulation.html
including Atmospheric Tides: http://en.wikipedia.org/wiki/Atmospheric_tide
as well as evaporation and condensation may help to drive changes in
Atmospheric Pressure:
http://en.wikipedia.org/wiki/Atmospheric_pressure
http://www.atmos-chem-phys-discuss.net/10/24015/2010/acpd-10-24015-2010.pdf
Solar Ultraviolet (UV) radiation; http://en.wikipedia.org/wiki/Ultraviolet
appears to varies by approximately 10% during the solar cycle; http://www.nasa.gov/topics/solarsystem/features/solarcycle-sorce.html
has been hypothesized to influence Earths climate; http://wattsupwiththat.com/2011/04/05/courtillot-on-the-solar-uv-climate-connection/
and variations may influence the breaks down of Methane;
(Source TBD)
however Leif argues that, "This is well-trodden ground. Nothing new
to add, just the same old, tired arguments. Perhaps a note on EUV: as you
can see here (slide 13) http://lasp.colorado.edu/sorce/news/2008ScienceMeeting/doc/Session1/S1_03_Kopp.pdf
the energy in the EUV band [and other UV bands] is very tiny; many orders
of magnitude less than what shines down on our heads each day. So a larger
solar cycle variation of EUV does not make any significant difference in
the energy budget.
Leif Svalgaard says: April 5, 2011 at 7:54 pm
Solar Wind; http://science.nasa.gov/science-news/science-at-nasa/1999/ast13dec99_1/
Solar Coronal Holes; http://helios.gsfc.nasa.gov/chole.html
Solar Solar Energetic Particles (SEP); http://helios.gsfc.nasa.gov/sep.html
Solar Coronal Mass Ejection;
http://www.esa.int/esaSC/SEMF75BNJTF_index_0.html
http://www.ratedesi.com/video/v/8AuCE_NNEaM/Sun-Erupts-to-Life-Unleashes-a-Huge-CME-on-13-April-2010
http://www.youtube.com/watch?v=A783VS52QNw&feature=player_embedded
http://www.youtube.com/watch?v=BDZj1CmsJ64&feature=player_embedded
Solar Magnetosphere Breach; http://www.youtube.com/watch?v=Hd9DXTRqY94&feature=player_embedded
http://www.youtube.com/watch?v=nVqWH5Qlg8Y&feature=player_embedded
Solar Polar Field Reversal; http://science.nasa.gov/science-news/science-at-nasa/2001/ast15feb_1/
Solar Sector Boundary; http://science.nasa.gov/heliophysics/focus-areas/magnetosphere-ionosphere/
Solar Grand Minimum;
Leif Svalgaard says: February 6, 2011 at 8:26 pm
If L&P are correct and sunspots become effectively] invisible [not
gone] it might mean another Grand Minimum lasting perhaps 50 years. During
this time the solar cycle is still operating, cosmic rays are still modulated,
and the solar wind is still buffeting the Earth. It will lead to a cooling
of a couple of tenths of a degree."
Solar Influences on Climate: http://www.leif.org/EOS/2009RG000282.pdf
Statistical issues about solarclimate relations: http://www.leif.org/EOS/Yiou-565-2010.pdf
especially when released by volcanoes; http://en.wikipedia.org/wiki/Volcano
which have been shown to influence Earths climate;
http://www.geology.sdsu.edu/how_volcanoes_work/climate_effects.html
http://www.longrangeweather.com/global_temperatures.htm
including in the infamous Year Without a Summer; http://en.wikipedia.org/wiki/Year_Without_a_Summer
which was partially caused by the 1815 eruption of Mount Tambora; http://en.wikipedia.org/wiki/1815_eruption_of_Mount_Tambora
and is called a Volcanic Winter: http://en.wikipedia.org/wiki/Volcanic_winter
Geothermic Energy can also warm the atmosphere through Hot Springs;
http://en.wikipedia.org/wiki/Hot_springs
Or warm the ocean through Hydrothermal Vents: http://en.wikipedia.org/wiki/Hydrothermal_vent
Which can be a factor in Hydrothermal Circulations: http://en.wikipedia.org/wiki/Hydrothermal_circulation
can all significantly impact Earths climate upon impact.
It has been hypothesized that Galactic Cosmic Rays; http://en.wikipedia.org/wiki/Galactic_cosmic_ray
http://en.wikipedia.org/wiki/Cosmic_ray
modulated by Solar Wind, may influence cloud formation on Earth:
http://wattsupwiththat.com/2009/08/04/a-link-between-the-sun-cosmic-rays-aerosols-and-liquid-water-clouds-appears-to-exist-on-a-global-scale/
Galactic Magnetic Fields also result in the; http://www.scholarpedia.org/article/Galactic_magnetic_fields
which may influence the hypothesized Oort cloud; http://en.wikipedia.org/wiki/Oort_Cloud
Besides the galactic tide, the main trigger for sending comets into
the inner Solar System is believed to be interaction between the Suns
Oort cloud and the gravitational fields of near-by stars or giant molecular
clouds.
7. Magnetic Forces; http://en.wikipedia.org/wiki/Earth%27s_magnetic_field
appears to be generated in the Earths core by a dynamo process, associated
with the circulation of liquid metal in the core, driven by internal heat
sources
Animal Anthropogenic including:
Carbon Dioxide, Methane, Nitrous Oxide, Ozone
Particulates, especially Black Carbon/Soot, Aerosols
Icebreakers/Arctic Shipping/Fishing/Cruise-Line Transits
Contrails
Nuclear Power Generation Including Ships
Land Use Changes Including De and Re-Forestation
Urban Heat Islands
Run Off From Asphalt/Urban Heat Islands
Fossil Fuel Energy Generation Waste Heat
Sewage/Wastewater Treatment Discharge
etc.
Animal Non-Anthropogenic including Plankton etc.
General summaries of the potential variables involved in Earths climate
system;
http://www.physicalgeography.net/fundamentals/7y.html
http://oceanservice.noaa.gov/education/pd/climate/factsheets/whatfactors.pdf
Radiative
forcing is a purely fictional concept Roy Clark says:
September 4, 2011 at 8:50 pm
Radiative forcing is a purely fictional concept that was introduced
in its current form by Manabe and Wetherald in 1967.
Here are the modeling assumptions taken directly from the second page
of that paper. They are still used explicitly in the large scale climate
models. [This is the input garbage before the gospel gets created.] The
radiative convective equilibrium of the atmosphere with a given distribution
of relative humidity should satisfy the following requirements:
1) At the top of the atmosphere, the net incoming solar radiation should
be equal to the net outgoing long wave radiation.
2) No temperature discontinuity should exist.
3) Free and forced convection, and mixing by the large scale eddies,
prevent the lapse rate from exceeding a critical lapse rate equal to 6.5
C.km-1.
4) Whenever the lapse rate is subcritical, the condition of local radiative
equilibrium is satisfied.
5) The heat capacity of the Earths surface is zero.
6) The atmosphere maintains the given vertical distribution of relative
humidity (new requirements).
There is no such thing as climate equilibrium.
The short term net flux is never in balance.
There is no local radiative equilibrium anywhere in the troposphere.
The heat capacity of a real surface is never zero.
The equilibrium surface temperature calculated by the climate models
is not a measurable climate variable.
Also, the empirical radiative forcing constants are calibrated
using the meteorological surface air temperature (MSAT) not the real surface
temperature.
Every single result derived from the use of radiative forcing since
1967 is nothing more than climate astrology.
The FUTILITY
of Man-made Climate Control by limiting CO2 emissions [AUTHOR UNKNOWN]
Just running the numbers: watch
If these numbers are in the right ballpark the whole Catastrophic Anthropogenic
Global Warming scare just evaporates.
On average world temperature is ~+15 deg C. This is sustained by the
atmospheric Greenhouse Effect ~33 deg C. Without the Greenhouse Effect
the planet would be un-inhabitable at ~-18 deg C. The Biosphere and Mankind
need the Greenhouse Effect.
Just running the numbers by translating the agents causing the Greenhouse
Effect into degrees centigrade:
Greenhouse Effect = ~33.00 deg C
Water Vapour accounts for about 95% of the Greenhouse Effect = ~
31.35 deg C
Other Greenhouse Gases GHGs account for 5% = ~1.65 deg C
CO2 is 75% of the effect of all accounting for the enhanced effects
of Methane, Nitrous Oxide and other GHGs = ~1.24 deg C
Most CO2 in the atmosphere is natural, more than ~93%
Man-made CO2 is less than 7% of total atmospheric CO2 = ~0.087 deg
C
the UK contribution to CO2 is 2% equals = 1.74 thousandths deg C
the USA contribution to CO2 is ~20% equals = 17.6 thousandths deg
C
So closing all the carbon economies of the Whole World could only
ever achieve a virtually undetectable less than -0.09 deg C. How can
the Green movement and their supporting politicians think that their remedial
actions and draconian taxes are able to limit warming to only + 2.00 deg
C?
So the probability is that any current global warming is not man-made
and in any case such warming could be not be influenced by any remedial
action taken by mankind however drastic.
As this is so, the prospect should be greeted with Unmitigated Joy:
concern over CO2 as a man-made pollutant can be discounted.
it is not necessary to damage the worlds economy to no purpose.
if warming were happening, it would lead to a more benign and healthy
climate for all mankind.
any extra CO2 is already increasing the fertility and reducing water
needs of all plant life and thus enhancing world food production.
a warmer climate, within natural variation, would provide a future
of greater opportunity and prosperity for human development. This has been
well proven in the past and would now especially benefit the third world.
Nonetheless, this is not to say that the world should not be seeking
more efficient ways of generating its energy, conserving its energy use
and stopping damaging its environments. And there is a real need to wean
the world off the continued use of fossil fuels simply on the grounds of:
security of supply
increasing scarcity
rising costs
their use as the feedstock for industry rather than simply burning
them.
The French long-term energy strategy with its massive commitment to
nuclear power is impressive, (85% of electricity generation). Even if one
is concerned about CO2, Nuclear Energy pays off, French CO2 emissions /
head are the lowest in the developed world.
However in the light of the state of the current solar cycle, it seems
that there is a real prospect of damaging cooling occurring in the near
future for several decades. And as power stations face closure the lights
may well go out in the winter 2016 if not before.
All because CO2 based Catastrophic Man-made Global Warming has become
a state sponsored religion.
And now after Splattergate thanks to the 10:10 organisation everyone
now knows exactly how they think.
Splattergate is classic NOBLE CAUSE CORRUPTION. It is probably the most
egregious piece of publicity ever produced in the Man-made Global Warming
cause. This short film shows doubting schoolchildren being blown up and
having their entrails spread over their classmates because they may have
been less than enthusiastic about the CAUSE. So any misrepresentation is
valid in the Cause and any opposition however cogent or well qualified
is routinely denigrated, publically ridiculed and as we now see literally
to be terminated.
Virtual
proof of climate science fraud
There is an unsolvable problem at the starting point of
global warming claims. There is no mechanism for carbon dioxide creating
global warming.
by Gary Novak, 7 Nov, 2013
Even if greenhouse gases created some global warming, they long ago did
all they can do. They absorbed all radiation available to them, so more
of such gases cannot absorb more radiation. This effect is called saturation.
Carbon dioxide absorbs all infrared radiation available to it by the
time radiation travels 10 meters from its point of origin (http://nov79.com/gbwm/hnzh.html#ten).
Doubling the amount of CO2 in the atmosphere can do nothing more than shorten
the distance to 5 meters. Shortening the distance is not increasing the
heat.
The first attempt by climatologists to rationalize saturation was to
claim saturation does not occur on the shoulders of the absorption peaks,
because few CO2 molecules have the unusual stretched bonds which absorb
at those wavelengths. After numerous attempts to explain such a mechanism
failed, the rationale shifted to the upper atmosphere, where saturation
supposedly does not occur. Contradictions go from bad to worse in the upper
atmosphere.
The most important fact about global warming is that the subject was
contrived without a scientific mechanism being known. It means there was
no scientific reason for contriving the subject. There still is no known
mechanism, while everything on the subject continues to be contrived.
The near-earth explanation fails due to extremely thin CO2 concentrations
on the shoulders of the absorption peaks. Shoulder molecules spread miniscule
amounts of heat over long distances resulting in no significant temperature
increase.
If 5% of CO2 molecules are assumed to have shoulder characteristics,
they would be spread over 20 times as much distance as the other 95%.
Not only do they represent 1/20th the heat captured by CO2, but they produce
1/20th as much temperature change with each unit of heat, since they are
spread through 20 times as much atmosphere. Multiplying 1/20 times 1/20
equals 1/400th as much temperature change as the other 95% of the CO2.
The total temperature increase resulting from doubling the amount of
CO2 in the atmosphere is said to be 1°C. Does this mean shoulder molecules
are doing this? If so, the other 95% must have increased the temperature
by 400°C. How do climatologists resolve these contradictions? They
don't. Which is why this subject is not science; it's religion and politics-religion
because 97% of the scientists could not be wrong, and politics because
energy systems are destroyed and economies are bankrupt imposing the fraud
upon everyone.
Actually, this shoulder effect is pre-saturation logic. After saturation,
no heat change exists for either the main 95% of the CO2 or the 5% on the
shoulders. In both cases, the distance reduces to half as CO2 concentration
doubles. Reducing the distance is not increasing the heat. Where then does
1°C temperature increase come from? It doesn't exist. But if it is
created by shoulder molecules, then the other 95% has to increase by 400°C.
Shifting the explanation to high in the atmosphere creates additional
absurdities. The first problem is that there is no way to get high enough
in the atmosphere to get around saturation. Climatologists picked 9 km
up as a means of staying within the troposphere. At that height, the atmospheric
density is 30% of that at sea level. This means distances increase by a
factor of 3.3 for absorption of radiation. Changing the distances is not
increasing the heat.
Another problem with the upper atmosphere is the temperature would have
to increase 24°C to radiate enough energy back to increase the temperature
of the near-surface atmosphere by 1°C. No temperature increase due
to CO2 has been detected in the upper atmosphere.
The basis for 24°C is this: (Assuming a mass of air at 9 km height
must heat an equal mass of air near the surface of the earth by radiating
energy downward.) Since half of the radiation would go upward and half
downward, the required temperature must be increased by a factor of 2.
Since 30% of infrared radiation goes around greenhouse gases, the temperature
must be increased by a factor of 3.3. Sometimes a range is given as 15-30%
for radiation going around greenhouse gases. If it's 15%, the temperature
increase high in the atmosphere must be 48°C rather than 24°C.
According to the Stefan-Boltzmann constant (http://nov79.com/gbwm/sbc.html),
matter at a temperature of -43°C emits 40% as much radiation as matter
at near-surface temperatures. So the temperature increase at 9 km up must
be divided by 0.40, or multiplied by 2.5.
About 30% of radiation would be reflected at sharp angles, which means
the temperature increase at 9 km must be divided by 0.70. The result is
(2 x 3.3 x 2.5) ÷ 0.70 = 24°C.
Climatologists have crazy ways of getting rationalistic numbers, but
they never produce the same ones twice, and the results never stand up
to criticism. The usual error is ignoring major effects. Then they bury
most of their math in models and do not allow other scientists to see what
they are doing. The models are now in conflict with an absence of temperature
increase over the past 15 years.
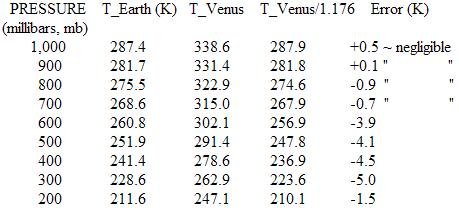 So
there is no greenhouse effect. You have just proved that climate science
is utterly wrong to think otherwise. This is the scandal that so many "experts"
in climate science, and all the scientific authorities, will not face.
Listen to the physicists that tell you there is no greenhouse effect; they
know without having to go to the Venus data -- and I am one of them. The
continuing incompetence on this vital point among so many scientists, for
more than a century, is amazing, and tragic. Here is a table more precisely
comparing the temperatures at various pressures in Earth's atmosphere (the
standard atmosphere) with the corresponding temperatures in Venus's atmosphere.
(updated 12/02/10)
So
there is no greenhouse effect. You have just proved that climate science
is utterly wrong to think otherwise. This is the scandal that so many "experts"
in climate science, and all the scientific authorities, will not face.
Listen to the physicists that tell you there is no greenhouse effect; they
know without having to go to the Venus data -- and I am one of them. The
continuing incompetence on this vital point among so many scientists, for
more than a century, is amazing, and tragic. Here is a table more precisely
comparing the temperatures at various pressures in Earth's atmosphere (the
standard atmosphere) with the corresponding temperatures in Venus's atmosphere.
(updated 12/02/10)
 There
is no sign whatever of a greenhouse effect on either planet. The fact that
the temperature ratios are so close to that predicted solely by their relative
distances from the Sun tells us that both atmospheres must be warmed, overall,
essentially in the same way, by direct IR solar irradiation from above,
not by surface emissions from below. Keeping it simple, the atmospheres
must be like sponges, or empty bowls, with the same structure (hydrostatic
lapse rate), filled with energy by the incident solar radiation to their
capacity to hold that energy.
There
is no sign whatever of a greenhouse effect on either planet. The fact that
the temperature ratios are so close to that predicted solely by their relative
distances from the Sun tells us that both atmospheres must be warmed, overall,
essentially in the same way, by direct IR solar irradiation from above,
not by surface emissions from below. Keeping it simple, the atmospheres
must be like sponges, or empty bowls, with the same structure (hydrostatic
lapse rate), filled with energy by the incident solar radiation to their
capacity to hold that energy.
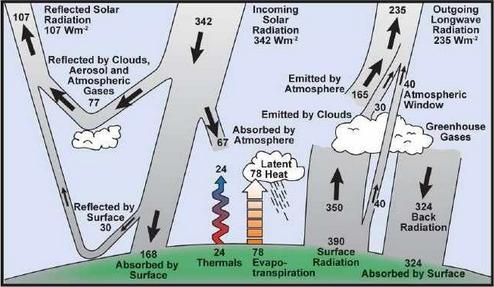 Earth's
Energy Budget, from Trenberth and Kiehl, 1997
Earth's
Energy Budget, from Trenberth and Kiehl, 1997
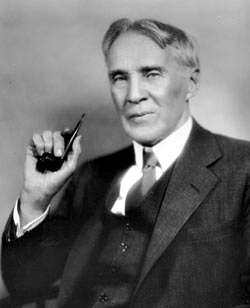 Lab
Experiment by John O'Sullivan
Lab
Experiment by John O'Sullivan