American Scientist Volume: 88 Number: 1 Page: 46
http://www.americanscientist.org/template/AssetDetail/assetid/14712
(c) American Scientist
DOI: 10.1511/2000.1.46
[Reader, this article has been reproduced here faithfully because it deserves widespread attention.
It has also been converted to a more printer-friendly version.]
Roll on, thou deep and dark blue Ocean - roll!
Ten thousand fleets sweep over thee in vain;
Man marks the earth with ruin - his control
Stops with the shore
 |
Figure 1. Overview of the Tsukiji fish market in Tokyo hints at the
variety of offerings available to seafood lovers. But the mix of species
being caught and sold around the world will probably not remain as rich
as it is today. The authors have determined that the output of global fisheries
- and presumably the compositions of the aquatic ecosystems from which
these fisheries draw - are slowly shifting away from top predators toward
organisms positioned lower on the food chain. This trend signals that many
of today's fisheries will in time collapse.
James L. Stanfield / National Geographic Image Collection |
When Lord Byron wrote these lines, nearly 200 years ago, exploitation of the seas was already well under way, and some marine species, such as right whales, were on the path to extinction. Yet the poet's verse supposes that the sea is immune from environmental degradation, a common misconception then and now. People can, in fact, ruin the sea as surely as they can ruin the land. The only difference is that ecological destruction in the ocean is harder to see, particularly when the damage is inflicted on the delicate and largely invisible web of marine life.
If one could don magic spectacles - with lenses that make the murky depths of the ocean become transparent - and look back several centuries to an age before widespread abuse of the oceans began, even the most casual observer would quickly discover that fish were commonly much more abundant. And many now-depleted species of marine mammals (a list that includes not just right whales but Hector's dolphins, Caribbean monk seals and Steller sea lions, among others) would, by comparison, appear plentiful. But without such special glasses, the differences between past and present oceans would indeed be hard to discern.
The opacity of the sea thus accounts, in part, for the disregard that most people display toward the warnings that we and others have been trying to convey. But the remoteness and impenetrability of this habitat are not the only impediments to our efforts. We have also been frustrated by the very richness of the ocean, in that it provides a seemingly never-ending supply of seafood. Indeed, with only rare exceptions, the total catch from global fisheries justs keep going up.
The premier source for such statistical information about world fisheries is the Food and Agriculture Organization, one of the technical organizations of the United Nations. Surveys compiled by the FAO are perhaps not as accurate or as detailed as many scientists would like, but they are in most cases all that is available. Two years ago, we examined a large set of FAO statistics on fisheries and showed that they do in fact portend disaster, despite the continuing growth in total amount being taken from the sea each year. The alarm rings when one realizes that the kinds of animals being caught have been changing in a fundamental way: In essence, rather than being satisfied with the big fish, people are now routinely going after many of the little ones too. Although the situation is not exactly analogous to eating one's seed corn, the result may be equally catastrophic.
Little fish serve the marine ecosystem in various ways, notably as prey for bigger fish. One straightforward way to describe the feeding hierarchy uses the notion of trophic level. By convention, marine plants (such as the tiny, drifting phytoplankton) and various forms of organic detritus make up the first trophic level; herbivores and detritivores are assigned to the second trophic level; and the first and higher-order carnivores are said to occupy trophic levels ranging from three to five.
More precisely, the trophic level of such predators can take on non-integral values, because the diet of these animals is commonly somewhat mixed. For example, an adult jack swimming around the Caribbean might eat equal amounts of herbivorous zooplankton (tiny plant-eating animals, which have a trophic level of two) and small fish that have a trophic level of three (say, because they consume only the local herbivorous zooplankton). This jack would then belong to trophic level 3.5.
Unfortunately, the trophic level of a captured fish is not stamped on its side. So it is not an easy task to track the average trophic level of all the fish caught each year. But after modeling the food webs of many marine ecosystems, we realized that we had accumulated a great deal of knowledge about the approximate trophic levels of commonly fished species. All that was needed was to combine these estimates with FAO catch statistics collected since the 1950s.
Doing so uncovered a systematic shift in the composition of global capture
fisheries, with the average trophic level showing a slow slide downward
over the past half-century. To judge the significance of our result requires
an understanding of the procedures we employed, of the statistics underlying
our analysis and of the various concerns that have been raised since our
study was first published.
On the LevelHistorically, the notion of assigning trophic levels in ecology passed through two stages. During the first phase, initiated by Charles Elton of the University of Oxford and Raymond Lindeman of Yale University, trophic levels were seen as pre-defined categories into which organisms could be pigeonholed - perhaps shoehorned is the better metaphor, given that complex feeding habits could not readily be accounted for. Fish that normally consume zooplankton were assigned a trophic level of three, because zooplankton (with a trophic level of two) normally consume phytoplankton (trophic level of one). This procedure ignores the fact that some zooplankton are carnivorous and thus should be assigned a trophic level somewhat higher than two, which implies that their predators should in turn be placed at trophic levels above three. |
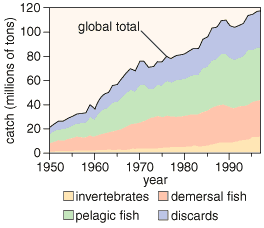 |
Figure 2. Global totals for the amount of fish caught during the past
half-century provide a misleadingly reassuring view of the state of the
world's fisheries. The increasing catch of small, free-swimming (pelagic)
species has masked stagnation in take of bottom-dwelling (demersal) fish.
Linda Huff; Source: United Nations Food and Agriculture Organization. |
Such complications forced this overly simplistic scheme to give way in 1975, when the late Frank H. Rigler, a zoologist at the University of Toronto, published an influential critique of the concept. It was then that William E. Odum (of the University of Virginia's Department of Environmental Sciences) and Eric J. Heald (of the University of Miami's Rosenstiel School of Marine and Atmospheric Sciences) pointed out that more precise estimates of trophic level could be obtained from actual observations of diet. Their advance, as followed in current practice, treats trophic level as an empirically determinable property of a species-like average size or metabolic rate.
So how exactly do marine biologists estimate trophic level for a given
species? One way is first to determine the average trophic level of the
various things that the organism eats and then add one to the value obtained.
Following this formula, marine biologists studying Pacific bluefin tuna
(Thunnus thynnus orientalis), a carnivore that consumes smaller
fish and large invertebrates such as squid, typically assign the adults
trophic levels ranging from 4.2 to 4.5, despite wide variation from place
to place in the exact composition of their diets. Still, there can be substantial
shifts in the value of trophic level that apply to different points in
development of this and other species, because dramatic changes in size
and behavior take place during the life of most fishes.
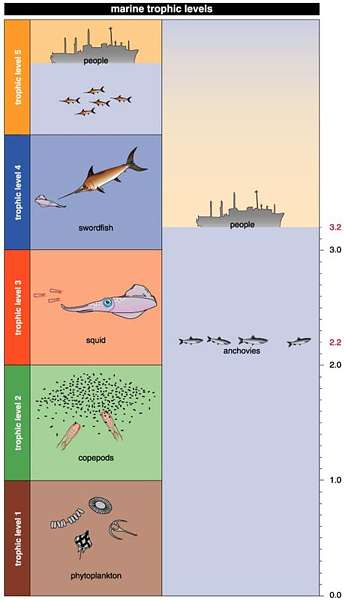 |
Figure 3. Trophic levels were initially defined to include only discrete
steps (left). Organic detritus and microscopic plants (phytoplankton) occupy
the first trophic level. Tiny zooplankton, which feed on phytoplankton,
reside at the second level. Creatures that eat zooplankton sit at the third
level, and so forth. But many marine creatures feed from multiple trophic
levels and so could not be fit into this classic scheme. Thus the modern
approach allows the assignment of trophic level to span a continuum rather
than forcing it to take on integral values. Marine biologists would, for
example, assign the anchovy, which supplements its main diet of phytoplankton
with some zooplankton, to a trophic level of about 2.2; people fishing
for anchovies (and eating a diet of only these small fish) would then be
assigned a trophic level of 3.2 (right).
Edward Roberts |
Another complication is that it is often quite hard to determine what all goes into the stomach of a fish. This difficulty can be overcome to a large degree by doing what we did: considering the organism as part of an integrated ecosystem and modeling the web of connections between the animals and plants in enough detail to gain a reasonable understanding of what each creature is consuming, at least on average.
A second method for estimating trophic level relies on a curious phenomenon of nitrogen biochemistry. Nitrogen, like the other common building blocks of life, comes in distinct forms. The most common isotope, nitrogen-14, has seven protons and seven neutrons in the nucleus. But a second stable isotope with eight neutrons, nitrogen-15, is also found in nature. Interestingly, biochemical reactions discriminate to a small degree between these two different kinds of atoms. So the nitrogen incorporated into the tissues of a sea creature does not have exactly the same isotopic ratio as is present in its food. Rather, the flesh of the animal tends to collect the heavier isotope. (The same enrichment takes place among terrestrial organisms. In this respect, you are not what you eat.)
Measurements of the nitrogen from various aquatic creatures have shown
that the isotopic ratio shifts by a roughly constant amount from one trophic
level to the next - no matter what species are involved. So the analysis
of nitrogen isotopes from an organism provides a convenient way to ascertain
its position in the food web without having to know exactly what it consumes.
All that is necessary is to compare the measured isotopic ratio with that
obtained from whatever organism sits at the bottom of the local food chain.
The difference in these two values (divided by the constant difference
between adjacent levels) immediately shows how far above base level the
creature should be placed.
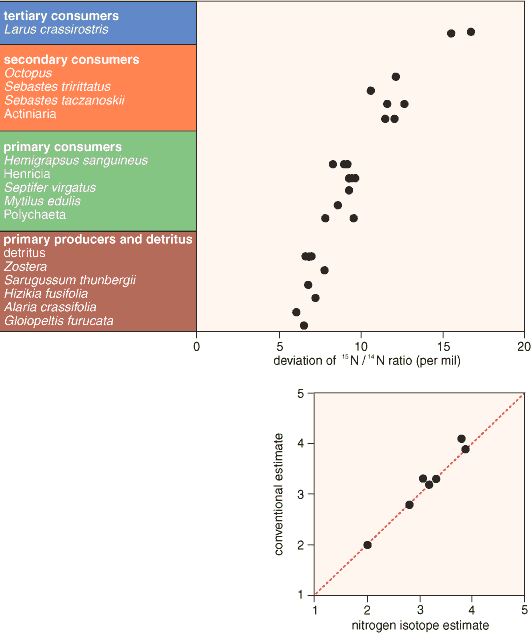 |
Figure 4. Nitrogen isotopes provide an indirect means for determining
trophic level. The ratio of the two stable isotopes of nitrogen (14N and
15N) changes with position on the food chain because organisms concentrate
the heavier isotope in their tissues. The difference in nitrogen isotope
composition from level to level is approximately constant, as Minagawa
and Wada (1984) showed for the waters off the coast of Hokkaido, Japan
(above). The authors have used this method to check their more conventional
strategy for assigning trophic level (by modeling the relevant food webs
on a computer) for certain test cases, such as for Prince William Sound
(right).
Edward Roberts |
Recently, we compared values of trophic level determined in this way to those we obtained from the more traditional approach, using Prince William Sound in Alaska as a sample ecosystem. Happily, the two sets compared favorably (Figure 4). This result adds to our certainty that the 220 estimates of trophic level that we used in our analysis of global fisheries, for which we employed just one method (modeling the food web), were largely correct.
We had, perhaps, less confidence in the accuracy of the FAO statistics for the catch from various parts of the world - a perennial problem for scientists trying to understand the functioning of global fisheries. Some of the concern arises from the breadth of the brush that most countries use in reporting their catches to the FAO. Although the surveys sometimes track individual species (cod, for example), the statistics often lump multiple species together and report values only at the level of genera (such as for hake), families (herring and sardines) or even higher taxonomic groupings (all bony fishes).
Still, with no similarly comprehensive alternatives, we had no choice
but to employ the FAO statistics, despite this and other shortcomings.
The results were nevertheless clear and reasonably consistent (Figure
5). In most places we looked, the average trophic level of the catches
has declined over the years. In the northwest Atlantic, for example, trophic
level plunged from a peak of nearly 3.7 in 1965 to 2.8 in 1997 (the last
year for which statistics are available), while in the northeast Atlantic
it fell from about 3.6 to 3.4. In the Mediterranean, the figure also diminished,
but it did so more gradually (slipping from about 3.1 to 3.0 during the
same period).
Hold the AnchoviesExceptions to this general pattern have certainly happened, but they are for the most part easy to explain. For example, average trophic levels of the catches from the South Atlantic and the Western Pacific have climbed somewhat during the past few decades - an effect we ascribe to the development of new fisheries in these regions. And the average trophic level of the fish taken from the South Pacific rose sharply during the 1970s, from about 2.3 to 2.9. This increase corresponds to the collapse of a huge industrial fishery for Peruvian anchoveta, a species with a markedly low trophic level (2.2), and the growth of a more modest fishery for horse mackerel, which occupies a considerably higher position in the marine food web (trophic level 3.3). |
Indeed, the rise and fall of the Peruvian anchoveta fishery creates a prominent dip in the curve for the global marine catch, which otherwise shows a largely steady decrease from a value of about 3.4 in the early 1950s to less than 3.1 today.
Might this worrisome trend be merely some sort of statistical artifact?
One could imagine, for example, that the decline we noted merely reflects
changes in the way the FAO collected its information, say, by using only
coarse groupings at first and refining the categories later. To test how
our results change when many species are lumped together, we regrouped
the relatively detailed totals available for the North Atlantic, so that
the accounting distinguished different kinds of fish only at high taxonomic
levels. The result of this exercise was to lessen the decline seen. Hence
the shift we computed with the full statistics must be, if anything, underestimating
the true extent of the drop.
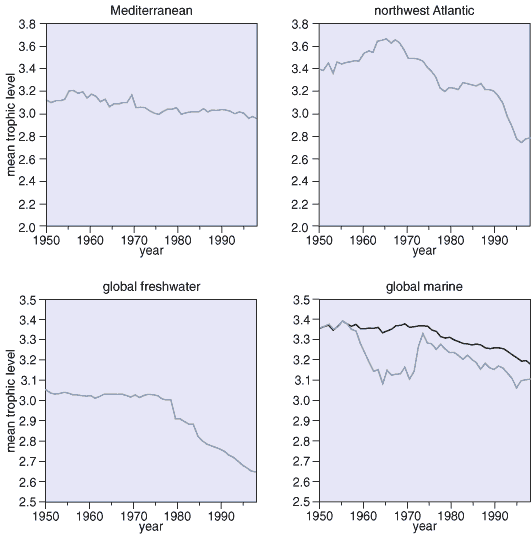 |
Figure 5. Mean trophic level of the catch from many regions, including
the Mediterranean Sea (upper left) and the northwest Atlantic Ocean (upper
right) has declined over the past 50 years. The global mean for freshwater
fisheries shows almost continuous decline (lower left), but the general
trend for marine fisheries (lower right) is complicated by the rise of
the fishery for Peruvian anchoveta in the late 1950s and its subsequent
collapse in the early 1970s. Because anchovies are assigned to a comparatively
low trophic level, output from this productive fishery creates a prominent
dip in the record of global marine catch (blue line).Omitting statistics
from the area containing this fishery produces a smooth decline (black
line).
Edward Roberts |
Admittedly, the procedure of assigning a single trophic level to a species rests on a rather shaky scientific foundation, because the feeding habits of many fishes change as they grow. Some begin life eating only plankton and hop up a full trophic level when they begin devouring other fish. Other species maintain roughly the same diet (and trophic level) throughout life. Still other species slide backward a step on the ladder, as larvae feeding on zooplankton and later turning to plants or detritus for sustenance when they reach maturity.
Fortunately, ignoring these complications only makes our estimates of trophic-level decline more conservative. Why? Because some 86 percent of the worldwide marine catch is made up of species that either maintain a constant diet throughout life or increase in trophic level as they grow. In the first case, assigning a single trophic level does not skew the results. The second case creates the possibility of bias, because there is a tendency in many fisheries to catch smaller and smaller specimens over time. But the actual trophic level of the catch from such a fishery would typically be decreasing, whereas our analysis would show it to be constant. That is, our assigning of a single trophic level to a species probably misses some of the real change that is taking place. Here again, we conclude that the trophic level of the global catch might, in actuality, be declining faster than we had documented.
But what if this effect applies only to the fish being netted, not to those remaining in the wild? Perhaps marine ecosystems are not changing at all, only people's choice of what they extract. Although such a selection bias is conceivable for lightly exploited fisheries, we do not consider it likely to be a widespread phenomenon. Indeed, in two cases one can test the hypothesis directly: in the Gulf of Thailand and over the Cantabrian Shelf, offshore from northern Spain. For the Gulf of Thailand, we determined the change in average trophic level (during periods of intense industrial fishing) using scientific trawl surveys of fish populations, rather than relying on the catch statistics. Francisco Sanchez of the Instituto Espanol de Oceanografia in Santander and several of his Spanish colleagues did the same for the Cantabrian Shelf. And both groups found that fishing pressure indeed altered the makeup of the ecosystem enough to depress the average trophic level. So we firmly believe that the average trophic level elsewhere is also truly declining.
It takes very little to convince oneself that this situation is alarming - for seafood lovers as well as for environmentalists. After all, the average trophic level of the global catch has already slipped from 3.4 to 3.1 in just a few decades, and there are not many more appetizing species to be found below this level. (Recall that 2.0 corresponds to copepods and other tiny zooplankton, creatures that are unlikely ever to be filling one's dinner plate.) So if the trend continues, more and more regions are likely to experience complete collapse of their fisheries.
Faultfinders can argued that our interpretation may be overly gloomy. Maybe the shift toward lower values of average trophic level simply reflects an increase in number of plankton feeders in many places, perhaps species that are now thriving from the coastal plankton blooms that take place when fertilizer leached from farmers' fields is carried to the ocean by rivers and streams. We have examined this possibility by comparing the decreases in average trophic level with the increases in amount of seafood being caught. In some places and times (for example, the Mediterranean Sea before 1986, or the South Pacific during the 1960s), declining trophic levels are matched by appropriately large increases in the amount hauled in each year. But for the most part, diminishing trophic levels do not coincide with burgeoning populations of plankton feeders. The overall picture is indeed quite bleak.
Medium and MessageOur study has prompted many fisheries scientists to review the statistics they have collected over the years for places of interest to them so that they can judge whether these ecosystems are suffering from a decline in trophic level. Our approach offers them a new tool for assessing whether fishing in a particular region is sustainable. But the publication of our results also engendered considerable critique from some members of the fisheries community. We welcomed this scrutiny and have tried to provide others with the means to examine the foundation of our analysis and to test the procedures we used. |
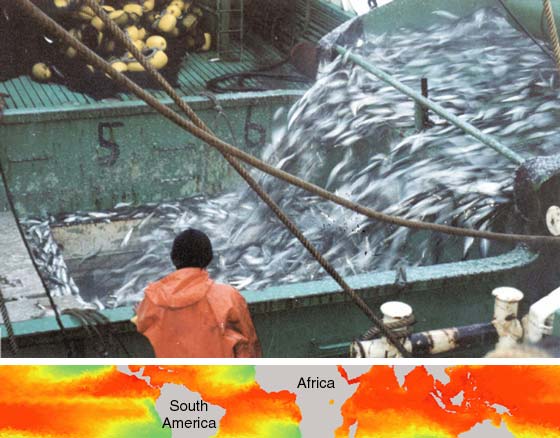 |
Figure 6. Fishing off the coast of Peru regularly provides a plentiful
catch of anchovies (photograph) because nutrient-rich water rises from
depth in this region. This coastal upwelling is so pronounced that satellites
carrying the proper sensors can chart this comparatively cold water reaching
the surface to the west of Peru and northern Chile (green on map).
Photograph courtesy of the Instituto del Mar del Peru, Proyecto Bitacoras de Pesca. Image of sea-surface temperature for May 1999 courtesy of the National Oceanic and Atmospheric Administration. |
As part of this same effort, we maintain a site on the World Wide Web - Fishbase.org - to aid communication among interested fisheries scientists and managers. We have also taken full advantage of the internet to disseminate "Ecopath," software we developed for modeling the food webs of aquatic ecosystems and determining such important quantities as the trophic level of various components.
We thus find ourselves manipulating computer spreadsheets more often than we would sometimes like. Without such work, we could never have mounted our study of global trophic levels. But with today's inexpensive personal computers and powerful software tools, the exercise has become rather straightforward. Indeed, the time was ripe to combine decades of statistical information about yearly catches - the fodder of fisheries research - with the modeling of food webs, a branch of ecology that had now grown mature. We thus believe that the results of our investigation provide a robust assessment of the shifts taking place in many regions of the globe - and for the world as a whole. Documenting the systematic decline in trophic level exposes the immense influence that industrial-scale fishing has had on marine and freshwaters ecosystems.
Clearly, we have skipped lightly here over many of the details of individual fisheries in an effort to give a comprehensive overview. Yet we see much value in presenting such a broad summary, one that should raise awareness of the scope of the changes that have taken place in lakes, rivers, estuaries, coastal waters and the open ocean. Perhaps if more people accept this message, fewer will be lulled into thinking, with Lord Byron, that humankind's ruinous ways have marked only the earth.
Bibliography
|
- Cushing, D. H. 1998. The Provident Sea. Cambridge: Cambridge University Press.
- Kline, T. C., Jr., and D. Pauly. 1998. Cross-validation of trophic level estimates from a mass balance model of Prince William Sound using 15N/14N data. In Proceedings of the International Symposium on Fishery Stock Assessment Models, ed. T. J. Quin II et al. Alaska Sea Grant College Program Report 98-01.
- Lindeman, R. L. 1942. The trophic-dynamic aspect of ecology. Ecology 23:399-418.
- Minagawa, M., and E. Wada. 1984. Stepwise enrichment of 15N along food chains: Further evidence and the relation between d15N and animal age. Geochimica et Cosmochimica Acta 48:1135-1140.
- Odum, E. P. 1969. The strategy of ecosystem development. Science 164:262-270.
- Odum, W. E., and E. J. Heald. 1975. The detritus-based food web of an estuarine mangrove community. In Estuarine Research, (volume 1), ed. L. E. Cronin. New York: Academic Press.
- Pauly, D. 1995. Anecdotes and the shifting baseline syndrome of fisheries. Trends in Ecology and Evolution 10:430. [CrossRef]
- Pauly, D., and V. Christensen. 1995. Primary production required to sustain global fisheries. Nature 374:255-257.
- Pauly, D. V. Christensen, J. Dalsgaard, R. Froese and F. Torres, Jr. 1998. Fishing down marine food webs. Science 279:860-863.
- Rigler, F. H. 1975. The concept of energy flows and nutrients flows between trophic levels. In Unifying Concepts in Ecology, ed. U. W. H. van Dobben and R. H. Lowe-McConnell. The Hague: Dr. W. Junk B. V. Publishers.
'