by Dr J Floor Anthoni (2000)
www.seafriends.org.nz/enviro/soil/erosion.htm
If the risk of erosion can be estimated in
advance, farmers would be better prepared and can apply the proper soil
conservation measures. A formula has been devoloped, the Universal Soil
Loss Equation, with which the risk of unsustainability can be calculated.
All soil eventually ends up in the sea, where it causes tremendous damage
in mysterious ways.
Ultimately, all soil ends up in the sea. It is a natural process that
brings nutrients to the sea where it fertilises the coastal fishery. But
too much of a good thing causes problems.
The landscapes we see today have existed for a very long time. Under
the influences of climate and cover, they have formed into shapes that
minimise the loss of soil and nutrients. A new look.
Estimating erosion The Americans have, for almost fifty years, pioneered a soil erosion
estimating system which requires the farmer to comply with required soil
management techniques, if he wishes to continue receiving government support.
The Food Securities Act of 1985 requires that farmers apply conservation
measures to remain eligible to participate in certain government programmes.
The erosion risk (A=annual soil loss) is calculated from a number of
factors that have been measured for all climates, soil types, topography
and kinds of land used in the USA. This technique helps to predict erosion
and shows farmers which farming methods to use. It also identifies erosion-sensitive
areas.
The factors are combined in a number of formulas of the 'Universal Soil
Loss Equation', which returns a single number, the tolerance factor, equivalent
to predicted erosion in ton/ha: A = RKLSCP , where:
A = Average annual soil loss: the predicted erosion or tolerance
factor in ton/ha, calculated from all others.
R = Rainfall erosivity factor: a factor dependent on climate and
likelihood of extreme events.
K = Soil erodibility factor: an estimate made from soil properties
as catalogued in the National Resources Inventory. It depends on the particle
sizes and proportions of sand, silt and clay, organic matter, granularity
and profile permeability to water.
L = Slope length factor: the slope length is the length of the field
in a down-slope direction. The larger slope length, the more water accumulates
at the bottom of the field, increasing erosion. It also depends on the
land's slope.
S = Slope steepness factor: calculated from the slope of the land
in %.
C = Cover management factor: depends on crop growth rate in relation
to the erosivity variation in the climate (?).
P = Supporting practice factor: reflects the use of contours, strip
cropping and terracing.
A tolerance factor of 4-11 ton/ha/yr is aimed for, which is still much
larger than natural soil formation, but which does not appear to affect
productivity. If the tolerance factor exceeds sustainability of productivity,
different cover management practices or supporting practices are selected
and enforced.
It is hoped that where no erosion estimating system is available, farmers
and land owners, consider the above factors in the ways they manage their
soils. Remember that sustainability of cropland is very difficult
to attain.
(Source: W J Elliot, G R Foster, A V Elliot: Soil erosion: processes,
impacts and prediction. in Lal & Pierce Soil management for
sustainability, 1991)
The International Geosphere-Biosphere
Program (IGBP) uses Relative Erosion Rates (RER) as per table on right,
for each type of land use. When taking land slope and rainfall into account,
they use the following formula for Relative Erosion Potential (REP):
REP= slope
^ 1.5 x RER x precipitation / 1000
where slope ^1.5 means slope
to the power 1.5 (less than squared).
rainfall precipitation is
the mean monthly rainfall for the peak rainfall month, in mm.
The problem of this formula
is that it does not take evapotranspiration into account but it recognises
that erosion occurs mainly when the soil is saturated and rainfall is maximal,
with heaviest rains occurring in one month. Note how the RER for croplands
and urban areas is over ten times that of an evergreen forest. Watersheds
with REP less than 5 are under low threat; between 5 and 45 medium and
those above 45 high. A maximum REP of 1400 is possible for large rivers
with poor soil management.
Refer also to the diagram
for erosion rate as a function of land slope
soil63.gif
Land category water body, lake
evergreen broadleaf forest
evergreen needleleaf forest
deciduous needleleaf forest
closed shrubland
open shrubland
woody savanna
savannas
permanent wetlands
croplands, natural mix
grasslands
croplands
urban & built-up
barren or sparse veg.
Once
the river water, loaded with sediment and nutrients, reaches the sea, it
forms a mud plume, the size of which increases gradually as the river flow
increases. The graph shows plume length (km) against river flow in thousands
of m3 per second, assuming that river plumes dissolve into the sea water
continuously and assuming there are no coastal currents to displace these
over huge areas. It is a pity that the plume is not expressed as surface
area or square km, but only as a distance extending out from the river's
mouth, hence the curve's flattening out.
The invisible plume of released
nutrients is estimated to be far larger and longer lasting. Very little
is known about these.
Affecting the sea Mud flowing into the sea, has a profound effect on it, although it
is not precisely known how it all works. Here is my own idea:
Remember that clay is a very fine mineral consisting of layers made
of aluminium, iron and silica. It carries a charge (negative) that binds
positive ions (cations) that are important to the soil's fertility. As
it washes into the sea, it is likely that its structure is affected, causing
the release of iron and silica and the soil nutrients.
People often don't realise that the area of land causing the problems,
is much larger than the area of coastal sea, which is often no more than
a few hundred metres. From the air, one can see clearly how mud slicks
stay close to the shore.
Muddy seas:
kill deep seaweeds
suffocate filter feeders
affect shellfish
cause problem blooms
damage beaches
pollute shores
For those interested,
the amount of land for each metre of shoreline, increases proportionally
with the diameter of the continent or island. Thus large continents potentially
have large coastal problems, depending also on climate and rainfall. New
Zealand, being small, has relatively small coastal problems.
Imagine the land a circle of surface pi x r x r.
Its circumference is 2 x pi x r. Divide the first by the last, gives
the ratio = r / 2 or diameter / 4. In relation to the surface
area of a continent, coastal problems increase with the square root of
continent size.
The clay provides precisely all
the nutrients that are in short supply in the sea, causing the plankton
to bloom with gusto. Normally this would be beneficial to marine creatures,
but there can be too much of a good thing. My thesis is that in the past
15 years (NZ), the sea has overstepped the line, resulting in problematic
plankton blooms. It is called eutrophication or overfeeding. Of course
these blooms are happening close inshore, where all our marine farming
is and where a large part of our ocean's biodiversity is found. To make
matters worse, the mud stays inshore for a long time, being stirred up
by every swell or storm. Coastal currents transport it along the shore,
exposing a much larger area to its ill effects.
Contributing factors:
mud stays inshore
is stirred up often
currents shift it
Could the sea become saturated? It would explain why problems are getting
worse, and why they are accelerating. Surely, this little amount of mud
and sewage from grazing stock and humans cannot saturate the ocean which
is so large and deep? The dust will just diffuse away, into the deep oceans
and currents will wash it away isn't it? Well, perhaps it does accumulate.
Although the world's oceans are immense and deep, the coastal margin
around continents, the continental shelf, is narrow and shallow. Here is
where most of the sea's productivity is found, most biodiversity, most
of the fisheries, and ALL of our shellfish fisheries and marine farming.
The diagram shows how nutrients cycle over the continental shelf.
Clay,
silt and sand (mud) enters the water. First it floats on the surface because
of the large amounts of fresh water, but gradually it becomes mixed with
salt water. The larger particles, the sand, settle out near the shore,
the silt further out and the clay still further, but it takes a long time
to get there. The sea bottom must be stirred many times, and as the bottom
sinks deeper, such events become rarer and rarer (see oceanography/waves).
Although exact figures are not known, it may take hundreds, perhaps thousands
of years for clay to arrive at the continental shelf. It may need an ice
age to lower the sea level by 100m, before the clay will move this far.
This alone is a possible cause for the shelf to saturate. But there is
more to it.
In the chemistry of the sea bottom, organisms like those found in soil,
are doing what soil organisms would do: breaking down dead organisms and
organic matter and producing nutrients (pink), which feed the plankton,
once they move upward to the sunlight. As can be expected, the bottom organisms
will also store nutrients, causing the sea bottom to hold a large amount
of the total amount of nutrients on the shelf. All this can be expected
from the ways an ecosystem works, but none of these postulations have been
proved (yet).
A
number of natural forces are at work to preserve the nutrients in the shallow
waters of the continental shelf where sunlight may reach the bottom. Winds
do not blow equally strong along the coast, which protects the water from
land winds. Thus the sea winds, blowing shoreward, outgun the land winds,
and water moves gradually shoreward. The ocean's currents that run along
the margins of continents, form eddies that herd the nutrients back over
the shelf, and deeper down they are found corkscrewing (in NZ counter-clockwise),
pushing nutrient-rich water up the continental slope and onto the shelf.
All these systems may work so well, that the continental shelf indeed
saturates, or at least becomes richer with time.
It is almost poetic that the minerals which once formed soil on land,
now form the sea soil, containing similar organisms, and doing similar
tasks. The sea soil provides attachment for bacteria, and these create
micro environments that enable them to do their work. Worms tunnel around,
giving the sea soil structure, while allowing oxygen to reach deeper layers.
Animals with jaws (sea 'insects' like fleas and slaters, but also bristleworms)
are available to dissect dead organisms. But unlike the land soil, the
sea soil does not have plants with roots. Instead, the living canopy is
represented by a thin soup of microscopic floating plants, the phytoplankton.
These single-celled plants grow rapidly, die after only a few days, and
sink down. But during their fall, bacteria in the water already start breaking
them down, doing their best to recycle the nutrients close to the surface.
But in the end, it all ends up on the bottom, where the sea soil does the
final recycling. See also the separate section on plankton.
The very
reason for researching this resource on the nature of soil, is the fact
that I have sound reasons to believe that mud from the land is the main
cause of the rapid deterioration in the seas around New Zealand. Having
made nearly 2000 dives here in 24 years, and living by the sea, close to
the first marine reserve of NZ, I have been able to make close observations.
By being under water so frequently, I have been able to see the changes
and to record these on movie film and photographs. I've seen that the only
thing that changed, was the amount of mud entering the sea. Every other
factor that could possibly be detrimental to the sea, has stayed reasonably
constant. I have now come to the conclusion that it is not possible to
save the sea without first saving the land.
In 1984 the reign of the
New Right started, subjecting this country to the full storm of globalisation,
destroying productive industries, making life difficult for farmers and
selling the people's assets. Our politicians rode to victory on the promise
of sustainable export-led growth. Today we can see that exactly the opposite
was achieved: stagnation of income, burgeoning debt, unsustainable debt
servicing, and a current account in deficit of over 30% of export revenue.
For every dollar we earn, we now spend two. Worst for the sea, the Government
abolished fertiliser subsidies, which resulted in hill country deteriorating
and eroding at an ever faster pace, while poor foliage opened these soils
to the damage from raindrops. In the past ten years I have observed that
the clarity of the sea, its problems and erosion have multiplied almost
three times. What can we expect in the next ten years? Ten times the problems?
Obviously, something needs to be done, and fast.
As the land is becoming tired
from lack of fertiliser, and farmers are pushed to the brink, also the
climate is changing. We are now experiencing heavier and more frequent
rainstorms than can be remembered. The ball game has changed and our opponent
has become stronger. We have to play a smarter game.
You would ask: where is the
data to support this? Yes, where is it? In their wisdom, scientists have
forgotten to put a network of water quality monitoring stations in place,
back in 1960 when interest in the sea began to accelerate and problems
first started to show. Although efforts are now being made, the data is
essentially missing and my own observations are perhaps the best we have.
I hope that many will join me in the fight to retain what we once had.
The
Seafriends website is now the ONLY place in the world that traces the problems
in the sea from their very origins on the land. It even goes further by
analysing what causes eutrophication of coastal waters, and how eutrophication
works. We even discovered an entirely new method to measure the health
of planktonic ecosystems. Follow the links from our decay
section and study the degradation
chapter. Everyone can now help to save our seas.
Floor Anthoni, 11 November
02000.
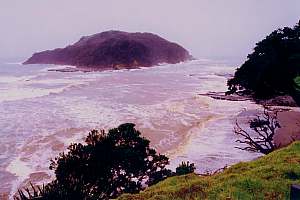
Since 1990, the sea has become much dirtier. This photo was
taken in the winter of 1996. It shows the first marine reserve in New Zealand,
near Goat Island (in the picture). A heavy rain storm colours the sea deep
brown with visibility less than 10cm. Such densities of mud damage sea
life. Before 1990, such events were unknown but now they occur 2-4 times
yearly.
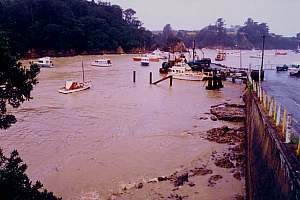
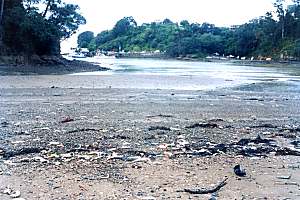
Sights like these, of mud filling coastal embayments, are
now common world-wide. This picturesque harbour of Leigh, New Zealand,
has a very small catchment area with well tended farms and properties.
Yet, a single rain storm today, brings more mud to the sea than ever before
in history.
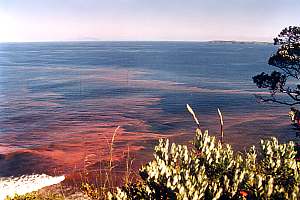
Drifts of orange plankton blooms of the sea spark Noctiluca
scintillans are now common all year round, whereas before 1990 some
would be noticed in warm summers. The sea spark is not poisonous, inflicting
little damage to the environment.
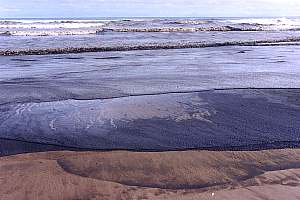
This is not oil, nor mud, but a very dense plankton bloom
at New Zealand's northern west coast. The visibility in the water would
be less than 5 cm! Blooms like these are a very recent phenomenon. Some
plankton blooms cause mortality in marine animals. Shellfish fisheries
are closed due to the presence of high levels of Paralytic Shellfish Poisoning.
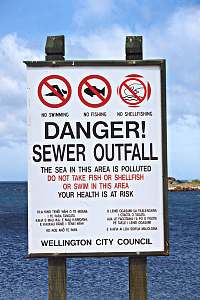
Health warning signs like these are now found where they
have never been before. The sea has been changed profoundly.
Wellington (NZ) discharges its untreated sewage straight
into the sea, along its prettiest seashore and most desirable beaches.
Obviously the health of the sea is not a priority!
.
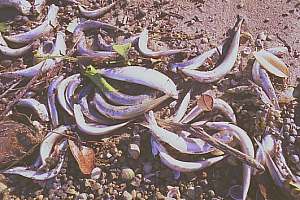
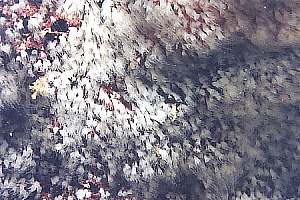
In June 1995, a mass mortality of pilchards happened around
New Zealand's north east coast. Pilchards feed on fine phyto and zoo plankton,
and grow fast. They are a main source of food for higher organisms like
commercial fish and dolphins.
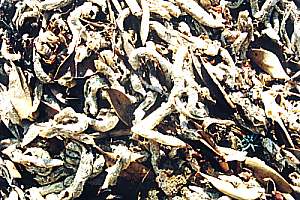
Close-up of dead pilchards. Pilchards are one of the few
fish capable of filtering very fine plankton, even phyto plankton (diatom
strings), reason why they grow fast. They form the basis for a food web
of fish and even dolphins. When pilchards are threatened, a chain of other
species is threatened too.
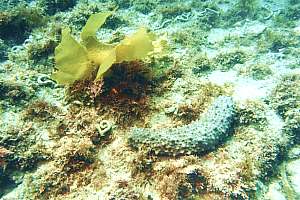
Dust settling on marine algae, shades them from the sunlight
which is already weak under water. But sea cucumbers come to their rescue.
With ten sticky mops in their mouths, they mop up the dust, thus providing
a mobile cleaning service. Notice how the area around the cucumber has
been cleaned. While moving from left to right, it leaves a long trail of
compacted waste behind.
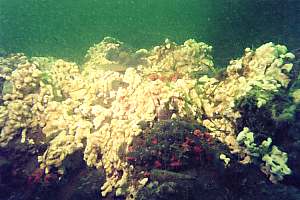
Parengarenga Harbour in New Zealand's far north, located
furthest away from the ill effects of population, was renowned for its
clear water and rich sea life. Now a caricature of its former glory, its
shores are covered in fast growing seasquirts and other opportunistic organisms.
Its biodiversity has plummeted.
These white polyps are the scyphistoma of jellyfish. Each
produces dozens of small jellyfish, adding up to a plague of them. The
polyps could establish themselves, because spots on the rocks, like this
one, fell bare because the organisms once living there, died by poison
from plankton.
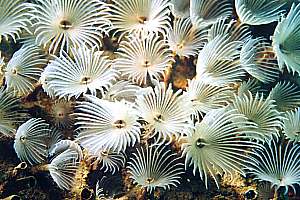
Carpet tubeworms, covering the sandy bottom with wall to
wall white, living carpet, were once fairly common. Of the five spots known
to me, only one can still be found today.
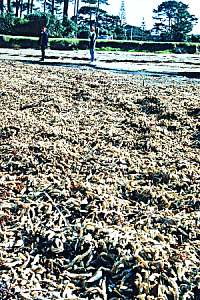
The sea bottom has suddenly been colonised by these parchment
tubeworms, washed up on this beach after a storm. Although the tube worm
may have lived in New Zealand long before, it suddenly found reason to
take over, destroying scallop beds and altering the sea bottom. Without
these worms, scallop beds have already been disappearing because of overfishing
and pollution.
Least loss landscapes In our fleeting moment of being alive on Earth, we are unable to see
the slow earth processes at work, those that shaped the landscapes around
us. We find it hard to believe that the last ice age ended only 4000-6000
years ago, and that the sea level rose by 100-120m in less than 2000 years.
We can hardly imagine that our coasts as recently as 7000 years ago, stood
at the margins of the continental shelves, some 10-100km out in sea. It
is difficult also to understand that when the sea level stopped rising,
about 4000 years ago, it stood precisely where it once was, hundreds of
thousands of years ago, in one of the inter-glacial warm periods like today.
It is also unimaginable that the sea coasts we see today are practically
the same of that era. Up until the industrial era, sea coasts have been
eroding only very slowly, and what we see today, is almost identical to
what once was, a very long time ago.
Underlying each landscape, is the geological process of uplift and subduction,
compression and corrugation, tectonic and volcanic activity, shaping the
landscape in a gross way. This is a very slow process, taking millions
of years rather than thousands. Erosion then rounds these shapes, quickly
at first but gradually more slowly, until it stabilises at a rate of minimal
erosion.
Least Loss Landscapes To further our thinking
about landscapes and erosion, I like to introduce a new concept, that of
least
loss landscapes. My contention is that all landscapes around us, including
the coasts and seascapes have stabilised into forms conducive to least
loss of nutrients and soil. This natural law can be proved by assuming
that if a part of the landscape did not conform, like being uplifted recently,
this part would then erode more quickly until it reached a form of minimal
erosion again. In this process, of course, the land cover of vegetation
plays an important role, as it does also in the sea.
This law predicts, that when
humans change the shape of the landscape, an increase in erosion will result,
which is hardly newsworthy, since we see frightening examples of it everywhere,
as discussed throughout this section on soil. The law also predicts that
when humans change the original land cover, like changing forests into
pasture, erosion will increase, but this is no news either. Conversely,
by bringing eroding land back into forest, erosion will be reduced. However,
the law also predicts that naturally bare land, when reforested, will cause
a momentary increase in erosion and loss of nutrients, until its
shape stabilises, which may take a millennium to complete.
More unexpectedly, the law
also predicts that erosion and loss of nutrients will follow climate change,
which affects not only the physical factors like moisture, rainfall, drought,
frost and so on, but also the composition of the cover of vegetation and
soil. An interesting consequence of this is that the layers of mudstone,
formed in the sea, may well represent periods of climate change, and their
thicknesses corresponding to the severity of such change.
Reader please note that the
above is not mainstream science, but entirely my own thoughts - a new paradigm
if you like. Use it to look at the landscapes you travel through, in order
to understand more about them.
 Once
the river water, loaded with sediment and nutrients, reaches the sea, it
forms a mud plume, the size of which increases gradually as the river flow
increases. The graph shows plume length (km) against river flow in thousands
of m3 per second, assuming that river plumes dissolve into the sea water
continuously and assuming there are no coastal currents to displace these
over huge areas. It is a pity that the plume is not expressed as surface
area or square km, but only as a distance extending out from the river's
mouth, hence the curve's flattening out.
Once
the river water, loaded with sediment and nutrients, reaches the sea, it
forms a mud plume, the size of which increases gradually as the river flow
increases. The graph shows plume length (km) against river flow in thousands
of m3 per second, assuming that river plumes dissolve into the sea water
continuously and assuming there are no coastal currents to displace these
over huge areas. It is a pity that the plume is not expressed as surface
area or square km, but only as a distance extending out from the river's
mouth, hence the curve's flattening out.
 Clay,
silt and sand (mud) enters the water. First it floats on the surface because
of the large amounts of fresh water, but gradually it becomes mixed with
salt water. The larger particles, the sand, settle out near the shore,
the silt further out and the clay still further, but it takes a long time
to get there. The sea bottom must be stirred many times, and as the bottom
sinks deeper, such events become rarer and rarer (see
Clay,
silt and sand (mud) enters the water. First it floats on the surface because
of the large amounts of fresh water, but gradually it becomes mixed with
salt water. The larger particles, the sand, settle out near the shore,
the silt further out and the clay still further, but it takes a long time
to get there. The sea bottom must be stirred many times, and as the bottom
sinks deeper, such events become rarer and rarer (see  A
number of natural forces are at work to preserve the nutrients in the shallow
waters of the continental shelf where sunlight may reach the bottom. Winds
do not blow equally strong along the coast, which protects the water from
land winds. Thus the sea winds, blowing shoreward, outgun the land winds,
and water moves gradually shoreward. The ocean's currents that run along
the margins of continents, form eddies that herd the nutrients back over
the shelf, and deeper down they are found corkscrewing (in NZ counter-clockwise),
pushing nutrient-rich water up the continental slope and onto the shelf.
A
number of natural forces are at work to preserve the nutrients in the shallow
waters of the continental shelf where sunlight may reach the bottom. Winds
do not blow equally strong along the coast, which protects the water from
land winds. Thus the sea winds, blowing shoreward, outgun the land winds,
and water moves gradually shoreward. The ocean's currents that run along
the margins of continents, form eddies that herd the nutrients back over
the shelf, and deeper down they are found corkscrewing (in NZ counter-clockwise),
pushing nutrient-rich water up the continental slope and onto the shelf.

 .
.