,
The Dark Decay Assay Method How it was invented, how it developed
and what it discovered
by Dr J Floor Anthoni, 2005
www.seafriends.org.nz/dda/method.htm
The Dark Decay Assay was not discovered through
one moment of inspiration but through stepwise exploration of an idea that
had a good chance of succeeding. This chapter shows how. Once a workable
method transpired, it was used to explore the environment, leading to more
discoveries but also to paradoxes that simply meant that there was still
more to discover and to understand.
Note! for larger graphs, click on the graph displayed
Simplification of the plankton ecosystem. A pH meter leads the way
but initial measurements are disappointing. How the DDA was discovered.
Hydrogen ions escape. Minimising hydrogen ion losses. Natural pH of the
sea.
A standardised method could be achieved only by stabilising temperature.
By elevating the temperature somewhat, experiments could be shortened considerably,
saving both time and effort while also increasing accuracy.
A failed linearity experiment showed that completely decomposed samples
decomposed further when a small amount of energy food was added. This reminded
us of the laws of thermodynamics that complete decomposition is not possible
without addition of a high quality fuel.
In any test which is intended to povide quantitative data, it is important
to know the relationship between the measured and the actual quantity.
Ideally such a relationship is linear, meaning that there exists a one-to-one
correspondence between the two. We encountered interesting difficulties.
For those who visit the sea under water, visibility is an important
indicator of water quality because the environment becomes poorer when
visibility decreases. Visibility may enable us to estimate the biomass
of the producers.
The DDA measures decomposer activity, of which the first three days
are the most decisive. The rate of attack (RoA) is one of the most important
outcomes, correlating well with degradation but results show inexplicable
variability.
Because freshwater lakes are not intensively interconnected like the
seas, their DDA curves are quite variable and indeed specific to each lake.
Results show that acidic lakes can accommodate higher densities of plankton.
If samples can be kept in storage without loss of information, it would
be beneficial to the accuracy of the method and it would also be easier
to obtain samples from people who do not do the actual measurements.
Inside aquariums of no more than one litre, one can grow a plankton
ecosystem until long-lived algae begin to grow on their walls, but even
then the biomass inside remains what matters.
Plankton in eutrophied environments is often growing at maximum densities,
leaving excess nutrients unused. These can be measured by diluting the
sample and growing plankton or other plant matter. But there are problems.
discovery The Dark Decay Assay was not discovered by accident. It followed on
from observations of decay underwater and the subsequent discovery of the
missing ecofactor, the planktonic decomposers. There had to be a way to
measure these and the only instrument capable of measuring such low concentrations
had to be an accurate pH meter.
It
is common knowledge that scientific research on plankton has been rather
disappointing, hampered by an ever changing mix of thousands of species
and millions of individuals, ranging from viral particles less than 0.2µm
to just visible zooplankton of 2mm, a range of over 4 orders of magnitude.
The only real progress could be expected from far-reaching simplification
of the whole, as shown in this diagram. The three arrows represent the
three main groups of life. The producers (green) make long biomolecules
with hydrogen bonds, thus scavenging hydrogen ions from the surrounding
water: the pH goes up. The food chain (orange) burns these biomolecules
with oxygen while also storing for growth: the pH changes little. The planktonic
decomposers (brown) break down wastes and dead bodies by breaking the biomolecules
and their many hydrogen bonds: the pH goes down. Although this is very
much an oversimplification of all the processes taking place, it sums up
its essence.
The orange side branch represents the respiration from plant plankton in
the dark but it has proven negligible. The brown side branch represents
death and decomposition of phytoplankton. When eutrophication exceeds unknown
limits, it can short-circuit the food chain such that most (if not all)
biomolecules (solar energy) end up feeding the decomposers.
The
simple idea is to measure the pH of the sea and if the pH is high, the
producers rule, which is good. If the pH is low, the decomposers
rule, which is bad. When measuring the actual pH in the sea around
the North Shore peninsula of Auckland, New Zealand, a range is found from
7.62 in a brackish upper-estuary creek to 8.13 at the East Coast beaches.
It corresponds roughly with what we would call the quality of the water,
from bad to good. Thus by going further out to sea, much
higher pH values should be found but they seem to level off at 8.20. Yet
there exists an enormous difference between the fauna found at remote islands,
compared to that found here at the East Coast beaches.
It
comes to mind that the differences in salinity may have caused the observed
differences in pH, and when these are plotted, a clear relationship emerges.
So what are we measuring? What is THE pH of the sea anyway?
Surprisingly,
a clear relationship is found between turbidity and initial pH. Turbidity
or poor visibility has always been a good indicator of water quality, and
finding this relationship is encouraging but unfortunately not very useful.
Paradoxes When measuring three points in the Manukau Harbour where Auckland's
sewage is discharged after treatment, it was clear that initial pH
could not be used as a measure of water quality. At French Bay inside the
harbour we measured 8.06 while we could see and smell that the water there
was very polluted, to the extent that oysters, eelgrass and sea lettuce
could no longer live there. At Cornwallis, halfway to the entrance, the
water was of much better quality and the shores showing more life as well
at a pH of 8.16. But at the entrance the pH slumped back to 8.07 with visibly
much better water, allowing even mussels (Perna canaliculus) and
stalked kelp (Ecklonia radiata) to grow. In a high tide rock pool
we measured a pH of 8.74. It became clear that the pH meter was able to
'see' things we could not see but that it was rather useless to measure
water quality with.
Breakthrough On the way home, while making a stop for an icecream, the DDA idea
was born. It was obvious that in the sea the producers were able to push
the pH up while at the same time the decomposers were pulling it down,
resulting in all kinds of possibilities. It occurred to me that we should
exclude the producers so that the decomposers could be measured. This could
easily be done by placing vials in the dark so that the phytoplankton would
immediately cease activity and eventually die, but the vials had to be
sealed in order to keep all chemicals inside. The resulting effect was
large and meaningful as the graph shows. At French Bay the decomposition
rate is indeed highest, followed by Cornwallis Beach and then the entrance
at Whatipu. The pH of the rock pool also dips to meet the final pH of the
inner harbour. The water at the entrance does not decay as much as that
of the inner harbour and final pH could well be a proxy for the total biodensity
in the water.
To
test whether decomposition had completed, we exposed the vials to light
again with varying results. After a small immediate recovery, pH remained
either constant or decomposition set in again. So what were we really measuring?
To
prove that the effect was caused by life, a slight quantity of formalin
(formol, a 35-40% solution of formaldehyde CH3.COH) was added. Even one
drop (~0.07ml) of formaldehyde (40%) was sufficient to halt decomposition.
Sample A was taken from a reasonably healthy harbour, whereas sample B
originated from the backwaters where salinity was also much lower. The
formol curves slowly creep towards pH=8.1, the natural pH of seawater,
as bacterial activity has been halted.
Powerplankton From two decades of careful observation, we knew that the area around
Cape Brett had the clearest coastal water found around Northland, New Zealand.
Samples taken here showed a great deal of variation with varying rates
of decomposition. While travelling over patch R, we noticed that the smell
of the seawater had changed, and stopped to take a sample. It turned out
to be rather unusual but more in line with what we had expected of all
previous samples. First the living plankton must die before rapid decomposition
can take place. However, in all previous (and future) samples we found
high chronic decay right from the first measurement.
In sample R there was hardly any measurable decay for over one day, one
night and another day, followed by unusually rapid decay. We were sure
that this was not an artifact, as all other samples, taken on the same
day, and going through exactly the same procedure, do not show anything
like it. Samples S and T confirm how this patch of powerplankton
dilutes with surrounding water.
What we were witnessing was some form of suicide (lysis), perhaps nature's
way of keeping the precious nutrients in the photic (sun-lit) zone. But
this mechanism would also make this kind of plankton eminently digestible.
It apparently also keeps the decomposers at a very low level, thereby lowering
their risk of infection. It is a form of super-healthy plankton.
We named this plankton assemblage powerplankton because of its
ability to transfer the solar energy straight into the food chain without
measurable losses: there is no measurable chronic decomposition (no left-overs
for the bacteria). We now posit (propose, assume) that the powerplankton
was once abundantly available, powering the once bountiful coastal fisheries.
Its loss has led to weak fish stocks that are easily overfished. But the
powerplankton
discovery may go one step further, explaining why fisheries worldwide have
entered a critical phase, even where managed extensively. Fishermen report
that fish are dying from starvation in seas green with chlorophyll. It
is a paradox that may now have been solved. Of course further confirmation
is necessary.
Rapid
loss of hydrogen ions In order to study the rate of loss of hydrogen ions, vials from two
batches were opened. Within hours their pH jumped up, equal to a rapid
loss of hydrogen ions, most likely caused by escaping decomposition gases
like carbondioxide CO2, hydrogen sulphide H2S, dimethyl sulphide (DMS),
methane CH4 and others. In the end, all samples converged on the same pH,
which we named natural pH or the intrinsic pH of the sea.
Such rapid loss of hydrogen ions was a little unexpected and made us aware
that the DDA method needed to be improved in order to minimise losses caused
by opening the vials for measuring.
Natural
pH and salinity In the beginning we observed how initial pH and salinity were somehow
related, and we wondered how much this was supported by measuring the natural
pH of the sea by first decomposing a sample fully and the ventilating it
to equilibrate with the air. It is an experiment taking two weeks for full
decomposition, followed by a full week of ventilation. In the meantime
some water has evaporated, which needs to be replenished with distilled
water, which in turn upsets pH somewhat. Two experiments were done showing
very little difference from pH=8.1 over a range of realistic salinities.
Note that natural fresh water has a large range of natural salinities,
depending on the geology of their catchment areas and volcanic vents. For
more accuracy a larger number of experiments is needed.
Natural pH measurement vs salinity
site
pH, day 0
pH, day 13
natural pH, day 20
final salinity ppt
Seafriends aquariums
7.92
6.98
8.10
42.9
Murrays Bay
8.19
6.95
8.09
37.4
Lucas Creek High
7.73
6.99
8.11
31.9
Lucas Creek Low
7.67
7.14
8.12
20.5
Lake Pupuke
7.70
6.90
8.19
18.2
Minimising hydrogen ion losses A number of experiments were done to investigate the best ways to minimise
hydrogen ion losses. The size of the gas bubble above the sample proved
to be of critical importance. During the experiment, but particularly towards
the end, gases equilibrate into the bubble such that their partial pressures
are equal to those in the liquid. At the moment the sample is opened, these
gases escape and upon completion of the measurement, the new air bubble
is slowly charged again with escaping gases.
Best results were obtained by:
minimising the air bubble: the Fuji film containers are particularly
well suited because of the shape of their lids. The problem is that the
air bubble must be large enough to allow insertion of the pH probe without
spilling liquid. So it can't be nil. The collar lid made from a normal
lid, allows the liquid to spill out without being wasted.
minimising the number of measurements: the number of measurements
was brought back to 7 with an additional check after one week. In the beginning
the sample is checked frequently with little risk of hydrogen ion loss
because partial pressures are still low. The number of measurements after
day 3 is minimised to only two, followed by a final check.
Experiments showed that decomposition was erratic and incomplete within
vials that were opened only once at the end. Apparently some gas exchange
and cross-contamination was necessary to attain useful results. We have
not been able to ascertain what was the precise cause of this, but the
later discovery of alcohol enhancement may provide the answer (see
further below).
For the actual time schedule, see manual/time
schedule. Note that it is based on temperature enhancement and stabilisation.
Temperature stabilisation
and enhancement Because the DDA tests depend entirely on microbial activity, it is
also very sensitive to temperature and fluctuations thereof. An affordable
portable incubator which could be powered from both 12 Volt DC and AC mains
power was not available, so we decided to construct our own by modifying
a commercially available Peltier-effect car fridge.
A Peltier element produces heat on one side and cold on the other side
when a current is passed through it. One side of the element is connected
to the inside of a thermo-insulated box and the other side to a heat exchanger
air-cooled by a fan. By reversing the current, the inside cools rather
than warms, as the outside warms rather than cools. A disadvantage of a
Peltier element is that it is not very efficient, requiring high power
for low cooling capacity. Its main advantage comes from its simplicity
and low cost.
Our modifications entailed a mechanical thermostat whose bulb
connects to the inside of the box. Also a small rechargeable emergency
battery was mounted to protect against power breaks, and whenever the unit
is disconnected from a power source. This has proved very helpful inside
cars that switch their cigarette-lighter power off when parked. The modifications
have proved effective and enabled us to standardise the procedure such
that measurements done in one time and place can now be compared with those
done elsewhere. But it also gave scope to elevate the temperature for the
following reasons:
One does not wish to switch the unit from cooling to warming during the
night, which could be avoided by elevating the temperature above the warmest
night temperature in summer. (27ºC for New Zealand)
A higher temperature also accelerates the experiment, which saves time
and effort. However, it also potentially introduces unwanted effects, such
as perhaps killing phytoplankton prematurely, or simply by being different
from what happens in the sea.
A higher temperature may reduce the escape of hydrogen ions, as the microbial
processes are very temperature-sensitive (about 100% per six degrees) whereas
the physical factors such as diffusion are proportional to absolute temperature
(about 2% per 6 degrees).
This
graph shows two temperature experiments conducted simultaneously at constant
temperatures of 21ºC and 27ºC. The six degree difference suggests
that one should find the cold sample lagging behind by about a factor of
two. In reality the outcome depends also on what is in the sample and it
also shows that accuracy deteriorates when the duration of the experiment
is extended. Note also that alcohol enhancement after day 5 delivers inconsistent
results.
.
Alcohol
enhancement A failed linearity test with agar added to expired water gave
the paradoxical results shown in this diagram. The quantities of the test
solution, a diluted agar, were chosen such that in a log-log graph a straight
line should result (1,2,4,..,256 drops). But what we really measured was
a renewed decomposition initiated by agar as energy food. Although the
highest concentrations of agar gave fastest response, even a single droplet
was sufficient to achieve the same a few days later. What was going on
here?
We then realised that the first and second laws of thermodynamics demand
that the energy locked up in biomolecules is insufficient for their complete
breakdown. Thermodynamic conversion losses and energy losses due to living,
cause an energy deficit that halts the process. When a fuel is added to
supplement this deficit (which is only small), decomposition proceeds and
(hopefully) comes to an end.
The problem with diluted fuels like agar and sugar is that they eventually
rot or ferment inside the bottle. They are also difficult to calibrate
and administer. We therefore resorted to ethyl alcohol, the most basic
of all fuels. A poison to higher organisms, it can effectively be converted
by bacteria and its effect is direct and drastic. From a 90% pure solution
a 20% solution was made by adding 3.5 parts of double-distilled water.
The first laws of thermodynamics 1. Energy can neither
be created nor destroyed. Thus all forms of energy ultimately convert
to heat.
2. All physical processes
lead to a decrease in the availability of the energy involved. This
defines that all energy conversions such as photosynthesis and decay are
accompanied by intrinsic losses. Some of these losses are due to the energy
being used by organisms for the sake of living. Other losses occur from
the thermodynamic conversions of one energy (a hydrogen bond, e.g.) to
another.
The ecological consequences of this discovery are rather fundamental
and important and require further study. In our thinking about closed nutrient
loops within ecosystems, we must now also account for the energy deficit
in the decomposition paths. Somehow from somewhere an additional energy
must be provided at a stage that it is needed and not just consumed.
With these thoughts in mind, we decided to add alcohol in an advanced
state of decomposition but long before exhaustion was reached, on day 5
of the experiment. Several experiments were conducted to compare the old
method with the new.
Once
the profound effect of alcohol enhancement was discovered, we asked ourselves
whether old experiments could be corrected to fall in line with the new
ones. Was the energy deficit threshold a fixed percentage and was it consistent?
In the scatter diagram a number of typical types of water were plotted,
but not all because many were almost duplicates. It turned out that the
West Coast water (90-100%) did not need much alcohol enhancement, whereas
east coast water does (20-40%), particularly that associated with clear
water (10-25%). The Seafriends aquariums showed erratic results because
its water quality was changing (prograding) rapidly (See aquarium
studies).
Paradoxically, the East Coast water shows much larger biodensities
than the West Coast water, which can not yet be explained.
Discussion - the slush
hypothesis From the freshwater lakes we discovered that a large
proportion of biomass is occupied by decomposers when lakes are eutrophied.
Because these lakes are also more acidic, making hydrogen ions easier to
scavenge, their phytoplankton productivity is correspondingly higher. But
the sea with its high and rather constant natural pH of 8.10 paints a different
picture.
From the day/night rhythm produced by freshwater lakes,
we see that a pH of 8.1 is a rather limiting ceiling. From this we suggest
that in the sea the scarcity of hydrogen ions forms a serious limiting
factor.
The above scatter diagram shows that the clear water
of the outer shelf leaves up to 90% of its biomatter undecomposed. In these
areas the pH is also higher. So there is a large amount of undecomposed
biomatter complete with unavailable nutrients, for which we coined the
new word slush (as in half molten snow). So the sea does
not only have phytoplankton (the old way of thinking) but also a
great deal of decomposers (the new way of thinking) and now also
slush.
Decomposers cannot decompose this slush because an additional fuel is not
available.
The slush hypothesis suggests that this is nature's way
of preserving nutrients (they may float up due to long fatty molecules)
but plants able to provide a high energy fuel can reach these nutrients
with the help of (friendly) decomposers in their surface slime. As the
slush is decomposed, the plant gets primarily hydrogen ions it craves for,
and as a bonus nutrients as well. Thus this mechanism enables marine plants
to grow much faster within a hydrogen ion starved environment. And as the
pH increases in the clearer waters, so does the amount of slush!
It is remarkable that the West Coast water near Auckland
behaves quite different, suggesting that it incorporates little slush as
it decomposes nearly fully and rather quickly as well. This can not yet
be explained.
Reader, please note that the slush hypothesis is very
speculative but if one does not think outside the square, one misses the
most important things to be discovered.
Vial size and type We
may have been lucky in our choice of vial because other types do not respond
as well to dark decay. The graph shows two separate experiments, done ten
days apart with water from the same origin (solid lines vs dotted lines).
Our Fuji film container is about 30ml, made from high density poly ethylene
(HDPE). One would say that a larger vial would yield more accurate results
as it averages over a larger quantity and one could make it such that a
very small air bubble remains. However, vial size should have no influence
on how the ecosystem inside develops, although the relative amount of wall
surface may have an effect. Two different sizes of transparent PVC of 200ml
(dark blue curve) and 400ml (light blue curve) did not respond to dark
decay, with no difference accounting for vial size. It appears as if volatile
substances in the PVC halt decomposition. However when after day five some
alcohol was added (1 drop per 10ml), the decomposition proceeded to the
same point as reached by the 30ml HDPE vial. Ironically, the largest vial
did not reach the proper ending pH, perhaps through hydrogen ion losses
or needing more alcohol
A glass vial of 220ml was part of the test (grey), and it too gave poor
results. Why the larger PVC and glass vials were unsatisfactory, cannot
be explained. Fortunately the much smaller vial works and this saves space
in incubators.
We also tested the amount of alcohol required by two separate experiments
(thin green curves and green dotted curves) for 1, 2, 4 and 8 drops per
30ml vial. The amount of alcohol had no significant influence over the
results even though the sea water used had a biodensity of over 500 hion
because of local sewage spills.
Proving linearity In any test which is intended to povide quantitative data, it is important
to know the relationship between the measured and the actual quantity.
Ideally such a relationship should be linear, meaning that there exists
a one-to-one correspondence between measured and actual quantity. Our preliminary
explorations of freshwater lakes gave good evidence of stunning precision
and linearity over four orders of magnitude, but a clean experiment would
settle any doubt. The test is really very simple: just add known quantities
to pure solutions and measure the results. However, a plethora of difficulties
has to be overcome.
How does one obtain pure sea water without organic matter (virgin natural
water)? All sea samples and all sea salts are contaminated with organic
matter. We even had difficulties obtaining pure fresh water. Even a biomedical
supply company sold us purified water as distilled water,
even though this purified water had very high concentrations of minerals
and organic matter! It wasn't even suitable for topping up batteries! Eventually
we purchased our own distiller and produced our own double-distilled water
but this introduced other problems.
For salt water we resorted to expired water of which all organic matter
has been decomposed, but this had its own problems and led to the discovery
of alcohol enhancement as explained above.
We obtained pure sea water from the island state of Niue where we measured
the underwater visibility at 60m, but surprisingly, even this clear water
contained high biodensity.
Biomass and visibility Divers know that the visibility of water is strongly correlated with
water quality, as the environment becomes poorer (degrades) when visibility
decreases, even when sediment deposition by mud does not play a role. This
is really a contradiction because increased densities of phytoplankton
should be beneficial for the food chain, resulting in better opportunities
for life. The Plankton Balance hypothesis and the Dark Decay Assay now
provide the answer to this paradox.
Degradation
of the underwater environment is mainly caused by the presence of decomposers
which increase their numbers suddenly as plankton becomes denser. To get
a grip on these issues, we measured visibility whenever possible and plotted
it against biomass in a log-log scale. The conceptual diagram shown here
gives an idea what is to be expected. Plankton responds to two main environmental
factors: availability of nutrients and availability of light. Where nutrients
are in short supply, the water clears and plankton biomass follows an inverse
relationship: double the biomass and visibility will halve. Towards very
murky waters, soiled by mud, plankton biomass follows a light-limited relationship:
halve the visibility and half the biomass can be maintained by sunlight.
The data points should thus fall inside the green boomerang which has a
maximum somewhere in the middle. Where the two lines cross cannot theoretically
be predicted and must be established from many sets of actual data.
However, in natural waters, the water quality is constantly changing due
to sudden rainfall and consequent ingress of sediments. such temporary
reduction in visibility, which may include suspended bubbles from waves,
pull the data points to the left but not down as there is no organic matter
in either mud or bubbles. There is also an unwanted influence from raw
sewage or other organic matter which pulls the data points down and to
the left because they are visible. Note that bacteria remain entirely invisible,
thus pulling data points down.
Note that excess (unused) nutrients cannot be measured by the DDA unless
the sample is diluted with pure (virgin) water and left to grow in sunlight
for a while (see further below).
The
diagram (which may need another one since alcohol enhancement) shows how
the theoretical expectations are by-and-large met by the actual data. The
idea is that the biodensity of phytoplankton lies on the green lines. What
is found to the left of it represents light obstruction without biomass
and what is below it, the biodensity other than that from producers. If
this is true, the decomposers can increase suddenly at about 9m viz, but
this does not happen predictably.
The grey cloud we named the graveyard, as it is associated with
(non-living) biomass accumulating at the surface without being visible.
The graveyard was found only in areas with relatively deep clear water,
in late autumn. The dots' colours correspond to the areas shown on the
map, which allows one to see how they are grouped.
Note how the biodensity, calculated from initial and ending pH, is plotted
upside-down on a logarithmic scale which is very similar to the pH scale.
A new unit is proposed, the hion which is the biodensity corresponding
to the number of hydrogen ions in a pH of 9.00. One day the hion will be
accurately linked to biodensity in micrograms per litre of dry organic
matter or carbon. However, when using the DDA it is not important to know
this.
biodensity = ALOG( - final pH ) - ALOG( - initial pH)
in ppb as hions
Work is continuing on this interesting aspect of the DDA, particularly
now that complete decomposition can be achieved by alcohol enhancement.
Please note that meaningful values for visibility can be obtained only
rarely, during prolonged calm dry weather, low wave energy and neap tides,
while taken from a boat, at least several hundred metres from the shore.
Meaningful visibility in estuaries can be measured only after prolonged
dry weather during neap tides.
Rate of Attack Due to temperature stabilisation, decomposition curves can be compared.
To our surprise, hardly any showed the shoulder typical of powerplankton,
as all suffered from ever-present chronic decay. The rate at which
initial decomposition happens can be measured as the Rate of Attack (RoA).
It has been standardised at 48 hours for the following reasons:
the very beginning of the curve is marred by uncertainties like warming
up
the initial pH in lakes and the sea tends to increase towards the end of
the day
after 48 hours most samples show a marked drop, large enough to be measured
accurately
phytoplankton tends to die from light starvation after 24h - 36h
after 48 hours both chronic and darkness-induced attack are measured
The RoA is calculated by subtracting the initial pH from the pH after 48
hours the way biodensity is calculated in hions.
Please note that the RoA cannot represent an absolute value since it
measures the decay of a particular assemblage of decomposers on a specific
assemblage of phytoplankton. Very aggressive decomposers attacking very
robust phytoplankters may show as a relatively low RoA. The RoA thus measures
producers versus decomposers rather than environment versus decomposers,
which is what we would really like to know.
As
we knew how important water visibility is to the quality of the environment,
we were interested whether this also showed in the measured rates of attack.
This graph plots both in a log-log relationship, visibility horizontally
and RoA in hion vertically. For comparison the linear relationship is drawn
as the green dash-dotted line. The colours correspond to the areas shown
on the map. Note how the various plankton assemblages neatly group together
although with large differences between them. One can say that the rate
of attack increases as visibility decreases and that this is much less
so in clear water where the curves flatten out. Also a sudden increase
is seen between 5 and 10m viz. Note that these measurements were done before
alcohol enhancement but that this should not affect these results. We found
a very similar relationship for freshwater lakes.
The curves consistently show a sudden increase between 5 and 15 hion RoA
indicating that this is when degradation sets in. Healthy water tends to
have RoAs less than 10 hion.
We
expected the rate of attack to be related to decomposer biomass and thus
to total biodensity. The idea is simple: the more bacteria, the steeper
their attack. The graph shows horizontally the relative rate of attack
as a percentage of biodensity and vertically log biodensity. The colours
correspond to the assemblages in the previous graph. The only certainty
obtained from this relationship is that low relative RoA is rare
and high relative RoA happens at the West Coast and that most relative
RoA is between 10% and 20% of biodensity. With some imagination one
can even say that relative RoA declines as biodensity increases.
Note that these results may ned to be reinterpreted with the introduction
of alcohol enhancement because that affects total biodensity and this scatter
diagram will be upgraded in due time.
Mapping results By mapping the results, we could obtain an overview of what the DDA
says about water quality in an area we know well from frequent diving.
The map shows the results of measurements done mainly between March and
May, late summer to autumn when water quality is at its best. But remember
that it is but a snapshot in time and does not reflect average conditions.
Much more sampling needs to be done throughout the seasons. Even so, results
look promising as they also correlate to degradation observed under water.
For a complete report visit map01.htm.
By
showing both RoA (in red) and biodensity (in green), one can get an idea
of the situation. None of the sites shows powerplankton. Healthy
plankton has RoA= 5 to 10 over biodensities of 30-60. Sick plankton
has RoA between 10 and 30 and killer plankton RoA over 30. (see
above) Maximum biomass is less than 100 hion and where it exceeds this,
raw sewage must be suspected. Using these criteria, one can see that the
seas around Northland are rather sick, sufficiently degraded to affect
fisheries.
The West Coast suffers from the runoff from a large area to the south
of this map, which flows through the Waikato River into the sea where 100/238
is marked. Also the (treated) sewage from one million inhabitants flows
into the sea from the Manukau Harbour where 69/160 and 54/154 have been
marked. These are extremely high RoAs and biodensities that make life impossible
for a vast range of species. In the Far North also very high biodensities
are found, which cannot be explained from local runoff and we suspect that
West Coast water flows northward, around North Cape and then back southward
along the east coast. This also needs further investigation.
Please note that the biodensities shown here may need to be reinterpreted
because of the improved technique of alcohol enhancement. However, the
charted rates of attack (red) remain valid.
Further mapping is needed and also further out to sea and all around
New Zealand.
Freshwater lakes Because freshwater lakes are not intimately interconnected like seas,
their DDA curves show high variability, and are indeed specific to each
lake. The minerals and acids of a lake depend largely on the geology and
land use of its surrounding catchment area and also on the presence of
volcanic vents. Freshwater lacks the salt of the sea that makes sea water
much less solvent. As a consequence, fresh water can store higher concentrations
of nutrients and minerals and produce much higher plankton biodensity than
seawater. All this shows clearly in DDA tests.
We became interested in freshwater plankton ecosystems because of the following
reasons:
stability: unlike the plankton in the sea, that of lakes cannot
drift away with ocean currents. It is therefore more stable and can be
studied where it stays, from season to season.
separation and variation: many lakes are entirely separated from
one another as water does not flow uphill. Thus depending on their catchment
areas, a larger range of extremes can be expected than in the sea. This
allows for discovering rules and natural laws that apply across their variety.
It also tests the DDA technique over a wide range of situations.
simplicity: freshwater ecosystems are inherently simpler than marine
ecosystems. They have fewer species and species assemblages.
accessibility: lakes can be accessed more easily than the sea and
in a single weekend samples can be gathered from a large number of different
sites.
small waves: due to their short wind fetch, lakes do not have waves
large enough to stir sediment over large areas. Visibility is thus more
related to phytoplankton density.
In
this single graph 24 New Zealand lakes have been brought together. It shows
that the DDA has a proven range from pH= 5.5 to 9.5, over four orders of
magnitude, which is quite outstanding for a measuring device. The curves
can be compared with one another because all have been incubated at a constant
elevated temperature of 27ºC but alcohol enhancement had not been
invented yet. At the conclusion of each curve, the vials were opened (while
still in darkness) to ventilate in order to establish the natural pH
of each lake. For some curves this has been drawn as the upward segment
ending in a large dot. The DDA curves are full of surprises and paradoxes,
some of which touched upon here.
Most lakes show very high rates of attack and high biodensities.
Only in Lake Tarawera and Taharoa (a dune lake in the north) is the powerplankton
found. Fishermen say that the trout there are fat and healthy, unlike those
in the other lakes. Lakes Rotorua and Rotoehu show a rise in pH before
decomposition sets in, perhaps because they are so shallow that the bottom
(benthic) decomposers dominate.
For completeness we also measured the crystal-clear spring
water of Hamurana Springs, that flows out into Lake Rotorua. It had a very
slight hint of peat (we tasted it) and measured a biodensity of 93 hion
of what is almost certainly non-living organic matter. We cultivated this
water to estimate its mineral/nutrient content and the DDA curve of this
aquarium
is shown in Ea, measuring 405 hion. Thus even very clear streams can contribute
large to the nutrient budget of a lake. Lake Rotorua had biodensities of
578 (north) and 1030 (city)! The Blue Lake due to its volcanic vents is
rather acidic and supports nearly 2000 hion biodensity! All very surprising
results, opening a world of interest. For the table of results see fresh01.htm
When
the rate of attack (over 48 hours, green) is plotted versus biodensity,
an almost straight line results (green), implying that bacterial attack
rate in 48 hours is a constant part (27% at 27ºC) of the measured
biodensity but much less for low biodensities. (Note that the black dash-dot
line gives precise linearity) This is the relationship we expected to find
for saltwater, but it has eluded us so far because marine plankton ecosystems
are more complex.
The straight-line relationship suggests a kind of normality
for lakes, that bacterial activity (and thus their biomass) is a fixed
part of biodensity. Some lakes deviate from the 'rule'. Pupuke, Rotoma
(roadside) and Quarry have lower than expected bacterial activity, whereas
the rather clear dune lake Taharoa has a higher one.
We also plotted the 24 hour rate of attack (RoA24, red) because this is
more representative in fresh water where decomposition proceeds rapidly.
For high biodensities, the curve follows the straight linearity, implying
that RoA24 is also a fixed part (10% at 27ºC) of total biodensity.
However, for low values of biodensity, the RoA decreases rapidly, signifying
plankton health. In this area a doubling of biodensity results in a five-fold
increase in bacterial attack. It suggests that truly healthy lakes have
biodensities very similar to the sea, less than 150 hion with much reduced
bacterial activity and RoA48 less than 10 hion.
One
of the amazing results of the lakes expedition is the discovery that the
maximum biodensity a lake can carry when it is fully eutrophied, is a function
of its natural pH. The lower this pH (the more acidic the lake),
the higher biodensity the lake can carry. It appears that the availability
of hydrogen ions is what matters to the maximum density of life in water.
In the graph we have named the lakes that deviate from the eutrophication
line as these are perhaps not fully eutrophied. The crystal clear water
of Hamurana Springs (30m viz) is of course exemplary but its cultured aquarium
falls inside the line. All named lakes are known to be of high quality
and even Rotoiti on both sides falls just left of the line. Note that lakes
Tarawera and Pupuke who stand out by their low rates of attack, are still
in a precarious state on the eutrophication line.
Note also that the sea (East Coast natural pH=8.12; Westcoast = 8.03)
falls neatly in place on this graph with Murrays Bay dipping far below
the line because of a massive ingress of raw sewage. The ultra-clear water
of Niue plots very high above the line.
What the graph suggests is that a water body's maximum biodensity
is limited by the value of its natural pH. The question remains whether
this natural pH is determined by nutrient concentrations from nitrates
and phosphates. In other words, is the eutrophication state of a lake given
by its natural pH? For the moment, the maximum biodensity follows this
equation:
maximum biodensity = ALOG( 1.55 - natural
pH ) hion, where the
factor 1.55 needs further confirmation.
The idea behind this graph is that lakes cannot overstep their maximum
biodensity as given by the eutrophication line and the above formula. Any
nutrients in excess cannot be used (but we have not measured these). It
is worrisome that even our clearest lakes are close to being fully eutrophied
and the situation in the sea is worse still in many places.
By
plotting biodensity versus visibility, it was hoped to find a relationship.
One would think that in still lakes the amount of phytoplankton can be
derived from measured visibility, and that the data points would be located
along two conceptual lines (reciprocal relationships like y=x and y=1/x),
one for nutrient-limitation and the other for light limitation. That Waahi,
Waikato and Waikare lie most left of the centre is caused by the amount
of sediment in these waters. Because the data is coherent in other aspects,
one cannot escape the conclusion that most of the biomass in the eutrophied
lakes is made up of decomposers. The thin V-curves indicate decomposer
levels of 2, 5 and 10 times that of the producers. In order to sustain
such high decomposer levels, the producers must be correspondingly more
productive. This seeming paradox needs further investigation.
By
placing the one litre 'aquariums' in light by day and darkness by night
at room temperature, we observed spectacular growth and decay in a single
day and night, after which the day-night rhythm disappeared. When plotted
against natural pH (on right), it reveals that phytoplankton growth indeed
follows the relationship discovered before for biodensity. Thus slightly
acidic lakes indeed maintain large biodensities of decomposers through
their sheer productivity by day. But this situation is not without risk
as the experiment shows. In the end the decomposers won and the lake in
the 'aquarium' died. It shows that lakes maintaining high levels of decomposers
can suddenly die by a combination of external factors such as a run of
dark days or a sudden warming.
Remarkably, three lakes scavenged hydrogen ions up to the magical ceiling
of pH=8.1 which may well be an overall limit. Ironically, the natural pH
of the sea is also 8.1 and most samples taken during a day are not far
from that level. It suggests that a pH above 8.0 is limiting plant growth.
Note that the lakes with high biodensities are the most interesting for
studying the day/night rhythm, but they are also the most vulnerable to
temperature change, which can destroy their natural ecosystems. So far
we have had disappointing results but we plan to continue this study under
more controlled conditions of light and temperature.
Discussion Freshwater planktonic ecosystems are perhaps easier to
study because they are rather similar with low numbers of species. Because
of this the relationships between biodensity and RoA and the natural pH
of freshwater bodies became evident whereas in the sea it eluded us. Even
so, the relationship between the clarity of the water and biodensity seems
a paradox.
Our conclusion would be that in the nutrient-limited
part of the graph (right-hand side), the difference between the red datapoints
and the green dash-dot line represents decomposer biomass and perhaps a
little of unknown dissolved organic material. The observation that bacterial
activity (RoA) is proportional to total biodensity, except for those lakes
with low biodensity, supports this. Is bacterial behaviour inside our vials
different from that in situ? They are obviously more aggressive due to
the higher temperature, but would their numbers have increased too? This
is unlikely as their food source has not changed, except for the phytoplankton
dying after 24-36 hours. From the graph one can see that the biodensity
of phytoplankton is a small part of the total as most lakes have 2 to 10
times more decomposer biodensity than producer biodensity. Would it mean
that Taharoa, Blue Lake and Rotoma have higher productivity to match this,
even though they have very different acidities? When the initial pH is
related to the natural pH, expressed in hions (see table in fresh01.htm),
one can see that in most lakes the producers can keep up with the decomposers.
But lakes Rotorua (-212 to -676) and Rotoehu (-225) cannot. Surprisingly,
clear dune lake Taharoa (-305) also fails in this respect. The crystal
clear Hamurana Springs water (-320) also fails because it has not seen
the sunlight for years.
The day/night rhythm experiment reported above indeed
indicates that phytoplankton productivity depends on the availability of
hydrogen ions and that it can achieve amazing rates of growth during the
few hours of daylight to match the decomposers' rates of attack which continues
unabated day and night.
In order to find answers to these puzzling paradoxes,
the freshwater lakes series is continued by resampling for every season.
Results are reported in freshwater studies (1) (fresh01.htm)
Keeping in storage If samples could be kept for a while without losing their information,
it would be easier to obtain them from helpers. One could go out in a boat
for one or more days, take samples here and there and these could be measured
later. Using this technique, one could place the samples in the incubator
all at the same time which would make the calculation of RoA easier too.
It would also be beneficial in case a previous experiment had not quite
finalised.
The
graph shown here gives the general idea. Samples were taken from a one
litre aquarium on days 0, 1 and 6, but these measurements date from a time
before temperature stabilisation and other improvements. The main question
is: can a plankton ecosystem be kept, and if so, for how long? What one
often forgets is that one of the most important environmental factors affecting
plankton is that it knows of no walls. Plankton organisms live all their
lives without ever encountering a wall. It means that macro algae and thread
algae cannot survive, because they need something to attach to. Once attached,
these longer-lived algae take over, changing their environment, like raising
the pH as they successfully scavenge hydrogen ions in competition with
the short-lived phytoplankton.
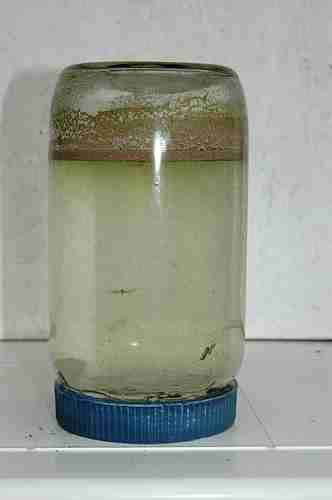
The graph follows an aquarium for over two weeks, and after one week
the pH rises. It can rise to 9.5, we noticed, as the plankton ecosystem
gradually changes, behaving more like a rock pool.
But biomass cannot escape or enter the jar if the jar is kept sealed. So
if biodensity is all that is needed, a sample can be kept in a one litre
jar almost indefinitely, when placed in front of a cool window facing away
from the sun. After many weeks, one sees the walls becoming green with
pasting and threading algae. Before doing the measurement, brush the inside
of the jar with a clean dishwashing brush to dislodge all living matter.
Shake well before dividing the content over the measuring vials.
In
order to test how well samples keep in a one litre jar, a sample of eutrophied
seawater was taken and over a period of three days two vials were taken
from it each day and subjected to the DDA. In the graph these have been
lined up on day one, and in order to synchronise at 'day 13', all samples
were treated to two drops alcohol on days 11, 12, 13, shown here as a single
day 12.
The curves show that initial pH first goes down, then up again, but
this depends on the amount of sunlight experienced through the window the
jar was placed before, at ambient temperature. The results have been summarised
in the table below. It suggests that samples can be kept for a few days
without seriously affecting the outcomes. So it is possible to have assistants
collect water samples during one day, to be tested that same evening or
the next day. It is necessary, however, to store the samples in a light,
cool place.
Note that alcohol at day 12 is not a good strategy as it introduces
uncertainty. It is better to administer the alcohol between days 3 and
5.
Keeping a sample for three days: Murrays Bay water, 2-4 May
2005 Alcohol enhancement with 3 drops 20% after day 12
Day
ipH
fpH
alc.pH
bio
alc.bio
RoA
Day 0
8.19
6.81
6.38
148
410
22.2
Day 1
7.94
6.81
6.35
143
435
22.1
Day 2
8.04
6.88
6.40
122
389
20.4
Growing plankton It is hard to believe that a sample taken from a lake or sea, looking
very much like a glass of clear drinking water, represents a fully operational
ecosystem with thousands of species and millions of individuals. Most of
these are sub-microscopic and their collective biomass rules when eutrophication
(over-feeding) is neared.
One would think that plankton can be grown from a sample of sea water,
but this is not entirely true as the composition of life inside a jar changes
and short-lived planktonic organisms are replaced by longer-lived sessile
ones. In a professional microbiology laboratory one can isolate a monoculture
of phytoplankters and cultivate these in a suitable medium under sterile
conditions such that decomposers and sessile algae are eliminated, but
this does not resemble the plankton ecosystems of the sea.
The method of growing plankton and/or micro algae is very useful to
determine the potential biodensity from free nutrients. The clear water
is contaminated with a few drops of salt or fresh water to introduce species,
and left to incubate in daylight in an open container to let carbondioxide
in. Evaporated water is eventually replenished by distilled water. After
3-4 weeks all nutrients will have been converted to biomatter and this
can be measured using the DDA. In this manner one can measure nutrient
concentrations in units meaningful to life (hions).
Ecosystem-in-a-bottle As a matter of interest, we have been successfully growing an entire
but simple ecosystem inside a one litre peanut butter jar. It consists
of phytoplankton, sessile algae and bacteria. In it swim a dozen or so
hardy brine shrimps and many eggs and babies. This ecosystem-in-a-bottle
is hermetically sealed and its lid glued in place, such that it cannot
be opened accidentally. It has been living in a cool place of the garden,
in half sunlight since January 2003. Whenever we teach about ecosystems,
the bottle is paraded on top of the overhead slide projector and children
have to figure out how my pets live from sunlight and never need
to be fed. Ideally, every classroom should have one.
Did you know the answer? In a true ecosystem everything
is recycled. The brineshrimps need food and they eat the planktonic algae
which you can see in the top as a green soup. The food provides them the
building blocks for growth and the energy for swimming. But they need oxygen
too, which is also provided for by the plants. But the plants need carbon
dioxide, which is what the shrimps breathe out. And they need nutrients.
These come from the shrimps' wastes which are converted by bacteria to
nutrients and carbondioxide. So, all minerals and oxygen are recycled.
The only thing needed from the outside is sunlight for the plants to grow.
So, in effect, the shrimps live from sunlight (and so do the plants, and
the bacteria).
Diluting for nutrients The DDA cannot measure free or unused nutrients in heavily eutrophied
waters or where fresh water mixes with salt. But a sample can be diluted
with virgin water and then left to grow until all nutrients have been used
up. Once that has been achieved, the once free and excessive nutrients
converted to biomatter, can be measured with the DDA.
The idea is simple, but where can one get virgin fresh or salt water with
the right amounts of minerals but without nutrients or biomatter? One would
be tempted to use distilled water instead, but we found that this seriously
alters the initial pH such that comparisons cannot be made.
We are looking at using salt water from a place where nutrients and
biomatter are indeed very scarce in order to continue these kinds of experiment.
It could also teach us more about how degraded fresh water mixes into clear
sea water.
 It
is common knowledge that scientific research on plankton has been rather
disappointing, hampered by an ever changing mix of thousands of species
and millions of individuals, ranging from viral particles less than 0.2µm
to just visible zooplankton of 2mm, a range of over 4 orders of magnitude.
The only real progress could be expected from far-reaching simplification
of the whole, as shown in this diagram. The three arrows represent the
three main groups of life. The producers (green) make long biomolecules
with hydrogen bonds, thus scavenging hydrogen ions from the surrounding
water: the pH goes up. The food chain (orange) burns these biomolecules
with oxygen while also storing for growth: the pH changes little. The planktonic
decomposers (brown) break down wastes and dead bodies by breaking the biomolecules
and their many hydrogen bonds: the pH goes down. Although this is very
much an oversimplification of all the processes taking place, it sums up
its essence.
It
is common knowledge that scientific research on plankton has been rather
disappointing, hampered by an ever changing mix of thousands of species
and millions of individuals, ranging from viral particles less than 0.2µm
to just visible zooplankton of 2mm, a range of over 4 orders of magnitude.
The only real progress could be expected from far-reaching simplification
of the whole, as shown in this diagram. The three arrows represent the
three main groups of life. The producers (green) make long biomolecules
with hydrogen bonds, thus scavenging hydrogen ions from the surrounding
water: the pH goes up. The food chain (orange) burns these biomolecules
with oxygen while also storing for growth: the pH changes little. The planktonic
decomposers (brown) break down wastes and dead bodies by breaking the biomolecules
and their many hydrogen bonds: the pH goes down. Although this is very
much an oversimplification of all the processes taking place, it sums up
its essence. The
simple idea is to measure the pH of the sea and if the pH is high, the
producers rule, which is good. If the pH is low, the decomposers
rule, which is bad. When measuring the actual pH in the sea around
the North Shore peninsula of Auckland, New Zealand, a range is found from
7.62 in a brackish upper-estuary creek to 8.13 at the East Coast beaches.
It corresponds roughly with what we would call the quality of the water,
from bad to good. Thus by going further out to sea, much
higher pH values should be found but they seem to level off at 8.20. Yet
there exists an enormous difference between the fauna found at remote islands,
compared to that found here at the East Coast beaches.
The
simple idea is to measure the pH of the sea and if the pH is high, the
producers rule, which is good. If the pH is low, the decomposers
rule, which is bad. When measuring the actual pH in the sea around
the North Shore peninsula of Auckland, New Zealand, a range is found from
7.62 in a brackish upper-estuary creek to 8.13 at the East Coast beaches.
It corresponds roughly with what we would call the quality of the water,
from bad to good. Thus by going further out to sea, much
higher pH values should be found but they seem to level off at 8.20. Yet
there exists an enormous difference between the fauna found at remote islands,
compared to that found here at the East Coast beaches. It
comes to mind that the differences in salinity may have caused the observed
differences in pH, and when these are plotted, a clear relationship emerges.
So what are we measuring? What is THE pH of the sea anyway?
It
comes to mind that the differences in salinity may have caused the observed
differences in pH, and when these are plotted, a clear relationship emerges.
So what are we measuring? What is THE pH of the sea anyway?

 Powerplankton
 This
graph shows two temperature experiments conducted simultaneously at constant
temperatures of 21ºC and 27ºC. The six degree difference suggests
that one should find the cold sample lagging behind by about a factor of
two. In reality the outcome depends also on what is in the sample and it
also shows that accuracy deteriorates when the duration of the experiment
is extended. Note also that alcohol enhancement after day 5 delivers inconsistent
results.
This
graph shows two temperature experiments conducted simultaneously at constant
temperatures of 21ºC and 27ºC. The six degree difference suggests
that one should find the cold sample lagging behind by about a factor of
two. In reality the outcome depends also on what is in the sample and it
also shows that accuracy deteriorates when the duration of the experiment
is extended. Note also that alcohol enhancement after day 5 delivers inconsistent
results.
 Degradation
of the underwater environment is mainly caused by the presence of decomposers
which increase their numbers suddenly as plankton becomes denser. To get
a grip on these issues, we measured visibility whenever possible and plotted
it against biomass in a log-log scale. The conceptual diagram shown here
gives an idea what is to be expected. Plankton responds to two main environmental
factors: availability of nutrients and availability of light. Where nutrients
are in short supply, the water clears and plankton biomass follows an inverse
relationship: double the biomass and visibility will halve. Towards very
murky waters, soiled by mud, plankton biomass follows a light-limited relationship:
halve the visibility and half the biomass can be maintained by sunlight.
The data points should thus fall inside the green boomerang which has a
maximum somewhere in the middle. Where the two lines cross cannot theoretically
be predicted and must be established from many sets of actual data.
Degradation
of the underwater environment is mainly caused by the presence of decomposers
which increase their numbers suddenly as plankton becomes denser. To get
a grip on these issues, we measured visibility whenever possible and plotted
it against biomass in a log-log scale. The conceptual diagram shown here
gives an idea what is to be expected. Plankton responds to two main environmental
factors: availability of nutrients and availability of light. Where nutrients
are in short supply, the water clears and plankton biomass follows an inverse
relationship: double the biomass and visibility will halve. Towards very
murky waters, soiled by mud, plankton biomass follows a light-limited relationship:
halve the visibility and half the biomass can be maintained by sunlight.
The data points should thus fall inside the green boomerang which has a
maximum somewhere in the middle. Where the two lines cross cannot theoretically
be predicted and must be established from many sets of actual data.