,
Northland, New Zealand Mapping biodensity and rate of attack
by Floor Anthoni
February to May 2005
www.seafriends.org.nz/dda/map01.htm
An almost complete map was made of the health
of the plankton around Northland, New Zealand. It began with a batch of
measurements that were not temperature-stabilised and ended with a batch
of which also complete degradation was measured by adding alcohol as bacterial
fuel. The original data is presented, including complete decomposition
curves. The measurements took place in autumn between 7 February and 7
May 2005. This is the first map made with the DDA while the method was
not fully optimal. Although RoA values will remain as they are, and all
data is adequate for comparison, the hion biodensities shown may need to
be adjusted for most cases.
Summary During late summer and autumn of 2005, the quality of the sea was measured
with the Dark Decay Method (DDA) around Northland, the densest populated
area of New Zealand. The city of Auckland straddles its narrowest isthmus,
between the Waitemata Harbour on the east and the Manukau Harbour on the
west. Auckland has 1 million inhabitants, whose (treated) sewage is disposed
of mainly through the Manukau Harbour where it enters the sea, diluting
quickly from 160 to 100 hion [1]. Some of Auckland's sewage is discharged
on its east coast into the inner Hauraki Gulf where it mixes slowly with
oceanic water. As a result, biodensities on Auckland's east coast are rather
high, ranging from 80 to 130 hion. Further north the (treated) sewage from
30,000 inhabitants of Orewa is discharged at the tip of the Whangaparaoa
Peninsula.
Just south of the Manukau Harbour, New Zealand's largest river, the
Waikato River, enters the sea through a long estuary, rich in water fowl.
The Waikato River begins at Lake Taupo in the centre of the North Island,
traverses many hydro lakes and finally flat dairy country and the city
of Hamilton with over 100,000 inhabitants and its corresponding wastes.
At Tuakau, just before it mixes with salt water, the river's biodensity
is very high (238) and its rate of decomposition (RoA) also (100). As a
result, in its estuary where it mixes with salt water, it exchanges biodensity
for free nutrients. This process continues in the sea until biodensity
settles at about 100 hion (nutrients are invisible to the DDA).
The north of Northland is very sparsely populated and consists of ancient
dunes and modern beaches. To find maximum biodensities of 100-130 hion
here, cannot be explained from the runoff from the land. We postulate that
the nutrient-rich waters from Auckland and the Waikato curve around North
Cape, flowing southward along the east coast. Very high biodensities are
now found down to the Poor Knights islands where massive degradation has
been observed between 2001 and 2005.
In the open and deep waters surrounding the Poor Knights Islands, a
remarkably dense layer was found, with correspondingly high rates of attack
but depth profiles showed normal values in the water underneath. We observed
unusual degradation in the shallows there.
North of the large Kaipara Harbour, a tongue of clear blue water was
found with low RoA and biodensity, presumably overlaying the olive-green
water of Auckland's west coast. Further north along the west coast of the
Far North, the dirty water returned, together with high RoA and biodensity
values.
In
reading the rates of attack (RoA in red) and biodensities (in green), it
may help to understand that there exists a relationship between plankton
density and underwater visibility. Phytoplankton reaches a maximum density
between 4 and 6 metre viz corresponding to about 90 hion. At around 10m
viz where biodensity measures half the maximum (about 40 hion), decomposers
may suddenly take over, causing also a sudden increase in biodensity. Thus
biodensities exceeding 90 hion are almost certainly attributable to decomposers
which in sunlit areas reach a combined maximum of around 130 hion. The
curves shown here serve to illustrate what happens on average, but the
actual composition of plankton assemblages is also important. Note that
salinity is critically important as fresh water can accommodate much higher
biodensity.
Note that all the measurements shown on this page were not done with
alcohol enhancement which would have increased biodensity considerably
in some highly polluted cases. For now, consider these qualities of plankton:
power plankton: characterised by a broad flat initial shoulder with
very little chronic decay, followed by very rapid decomposition, typically
measuring
5/40.
It is also characterised by a higher than normal initial pH (typically
+0.1). None of the measurements on this page show powerplankton.
healthy plankton: low RoA and healthy amounts of plankton: 6/40
to 5/20.
sick plankton: RoA between 7
and 20 and densities between 40
and 100.
killer plankton: RoA exceeding 20
and/or densities exceeding 100. Very
few organisms survive here.
Note also that the DDA method provides only a snapshot in time and that
all measurements on this page were done in the autumn when water quality
is at its best.
[1] one hion unit is the biodensity (biomass per
litre) corresponding to 1 ppb hydrogen ions decomposed, as measured with
a pH meter.
The inner Hauraki Gulf The
inner Hauraki Gulf contains very dirty water with high nutrient loads and
dense plankton. Treated sewage is discharged at Whangaparaoa (sites LAB),
the East Coast Bays (CD) with occasional spills of untreated sewage. This
expedition was done in a period of unusual calm weather, and also during
a neap tide. The DDA method had not been stabilised, hence the flat terraces
in the curves caused by the cooler nights. The red rectangle to measure
rates of attack with, has been stretched to approximate decay had temperature
been stabilised at 27ºC, but this has been judged unreliable for inclusion
on the summary map.
The curves suggest that three water masses or plankton
assemblages are found, corresponding to the clearer waters (GHIJ) and the
inner Hauraki Gulf (CDEF). The sample from inside the Gulf Harbour marina
(A) shows an ingress of sewage. Note that site F is the recently declared
Te Matuku marine reserve, which has a highly degraded environment with
very poor water quality.
Leigh to Little Barrier The
waters sampled here show high quality with low biodensity in a patch of
blue water between Little Barrier and the mainland. Another patch of clean
water is represented by sites OPQ. Sites HIK have similar water qualities,
while J and N are expected to be poor, but Goat Island (G) has worst water
quality of all. In recent time, massive degradation has been observed at
Goat Island marine reserve perhaps because of an excess in seaweeds now
dying due to a lack of herbivores. There is also a plague of brown fluff,
a highly poisonous dinoflagellate mat.
Notice the flat shoulder of site M where we saw brown
water mix with blue-green water but the curve does not have the steep drop-off
that is so characteristic of powerplankton. These measurements were
done before temperature stabilisation and before a standardised measurement
schedule and thus serve for comparison only. The results have not been
included in the summary map.
Leigh to Mokohinau The
measurements shown here were fully temperature stabilised and standardised.
This 250km round trip attempted a long transect from Te Arai Point jutting
out from a long sandy ocean beach, towards the Mokohinau Islands and beyond
to the territorial boundary (IJLM). Surprisingly, the quality of the water
found at the Mokohinau Islands (The Mokes) had high biodensity and
RoA (12/79) compared with Leigh Harbour (15/78), both showing a flat elbow
from day 5. This could mean that their eventual biodensities would be much
higher had alcohol enhancement been used.
The curves suggest a gradual mixing of Hauraki Gulf water
with the cleaner water found outside (M). Even so, the water found around
Great Barrier has its own characteristic (SRQP). Depth stratification measured
at J and M (see further below), show that the water is quite evenly mixed
down to 40m depth, particularly at site M where the bottom depth was 50m.
It may be interesting to know that we observed a strong current at 40m,
shearing the 30m isocline. No thermoclines were observed.
Whangarei to
Poor Knights This
long expedition saw a remarkable mix of waters and it gave some surprises
too. Beginning in Tutukaka Harbour, the water showed the RoA and biodensity
typical of an ingress of raw sewage (35/233) which restricts underwater
life considerably. Surprisingly we found a similar water quality at the
Poor Knights (45/303 at site A, near Rikoriko cave). Fortunately we also
carried out a depth survey which identified a shallow surface layer to
be the cause. However, none of the three sites measured gave values for
healthy plankton (U=48/86, V=48/123, A=45/303) and a similarity with near-coastal
Tutukaka harbour entrance can be seen. In recent times we have observed
steep degradation at the Poor Knights, particularly in the shallows. These
values make more sense when viewed together with the prograding Seafriends
aquariums.
Ironically, the healthiest water was found at the coast
between Matapouri and Mimiwhangata (sites EFG). We made a special effort
to include Danger Rock where often strange upwellings occur. As can be
seen from the graphs it stands out, but unfortunately the samples were
spilled during testing.
Along
the anchor chain we took samples at depths of 10, 20 and 40m in only three
places. Although visibility for these three places was rather disappointing
for this time of year (A=13.8m, B=16m, C=15.7m), plankton density was surprisingly
evenly spread down to 40m and possibly even deeper. Surprisingly, the Poor
Knights had much higher densities (92-107 hion) compared with the half-way
point between Te Arai and Mokohinau (site B=50-60 hion) and the territorial
boundary (site C= 33-52 hion). These densities cannot be explained from
the runoff from the land or from upwellings.
f046132: many Sandagers wrasses have fungal infections at
the Poor Knights. (2005)
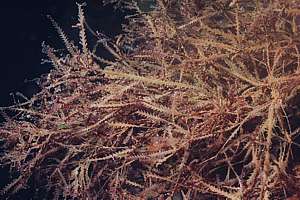
f046134: Vidalia red seaweed is found dying at the Poor Knights,
even in shallow water. (2005)
Far North The
Far North measurements shown here were all done by car such that there
exists a strong need to get data from further out in sea. Very high RoA
and density was observed in the Kerikeri inlet near Te Tii (37/129) which
we classify as killer plankton. Similar density but with substantially
less chronic decay (25/141) was encountered in Whangaroa Harbour, once
very rich in fish and other life but now suffering from high levels of
degradation. However, oysters tolerate these conditions. By comparison,
Parengarenga Harbour (site O) combined medium decay with high biodensity
(16/96), similar to the Rangaunu Harbour (site K with 11/128) and Mangonui
Harbour (site I with 8/108). In these three places young fish were found,
energetically feeding on zoo plankton (jack mackerel, parore, piper). A
substantial difference in RoA was found between west coast sites P (11/103)
and Q (20/108).
Manukau to Kaipara West
Coast waters are plagued by heavy sediment and nutrient loads from the
Waikato River, the Auckland sewage works and the northern branch of the
Kaipara Harbour. Decomposition rates are high and biodensities about the
maximum that sunlight can maintain. Even so, there must be an excess in
unused nutrients so high that the water can spread far out to sea and along
the coast while retaining high biodensity (100-120). We postulate that
this water flows north, around North Cape and then back south again and
that its furthest boundary now engulfs even the Poor Knights Islands. Our
measurements show that this is more than just a possibility.
Note that all measurements shown here were done by car,
from the shore. There are three distinct classes of water: the Manukau
water flowing northward (LKMO), mixing with the water from the Kaipara
Harbour (PQ) and a tongue of blue water descending and overlaying the colder
brown-green water (EF).
Inside the Manukau Harbour very high decay and biomass
are found, even though the excess nutrients were not measured.
West Coast Port Waikato The
Waikato River enters the sea through a narrow estuary. The inflow was measured
at the Tuakau bridge after a long period of no rains with a moderate biodensity
but very high decay (site O=100/238). Inside this estuary the fresh water
mixes with salt which makes it less solvent. Whereas fresh water of pH
7.5-8 can carry a high biodensity in plankton, salt water is limited to
about 90-100 hion. All freshwater plankton dies and becomes decomposed.
Saltwater plankton grows from the available nutrients but excess nutrients
remain. At Port Waikato (site N=17/126) about half the nutrients have been
converted.
As the water flows north at maximal densities (P=31/111,
Q=23/93) it remains very sick (R=15/107, S=16/137, T=14/107). Interestingly
we measured high initial pH and salinity at Orua Bay (site R) of 8.33 at
35.3 ppt salinity.
Kawhia to Raglan The
Kawhia to Raglan stretch was also done by car, yielding only near-coastal
samples. The steep elbow in samples NRO suggest that decay was energy-limited
and would have shown higher densities if enhanced by alcohol. But the results
show what was to be expected, a fully developed plankton assemblage at
maximum density and medium to high decay rates, with a slight exception
of Aotea Harbour and Raglan surf beach (sites Q, S)
Data In this chapter the relevant source data is presented. Because of the
accuracy of the DDA method and because the research presented here is of
an exploratory nature, only two samples were taken for each site. In the
first five days these were averaged by simply averaging the pH values.
For the biodensity calculations, the lowest values were taken for days
9 to 13 because hydrogen ions are easily lost during the assay. Biodensity
was calculated as:
biodensity = ALOG( -fpH ) - ALOG( -ipH )hion
(hydrogen ions ppb)
where ipH= initial pH and fpH= final pH
Please note that each batch of samples represents only a snapshot in time
and because they were taken in autumn after an unusual period of calm and
dry conditions, may represent the most favourable situation. Much more
sampling needs to be done.
The columns of the tables have the following meanings:
ref: vial reference. The letter used on the graphs.
site: site name or description
date.time: date and time as in yyyymmdd.hhmm
northing: northing co-ordinates from topographical maps or GPS.
Sometimes latitude at sea.
easting: easting co-ordinates from topographical maps or GPS. Can
also be longitude at sea.
viz: visibility measured in metres using a disappearing white object,
such as a secchi disc. When placed inside brackets, it is an estimated
value rather than measured.
sal: salinity in percent.
ipH: initial pH measured immediately after mixing the sample vials.
fpH: final pH upon completion of the DDA
apH: alcohol-enhanced final pH
bio: biodensity expressed in hions.
abio: alcohol-enhanced biodensity in hions
RoA: rate of attack measured over the first 48 hours in hions.
Goat Island to Mahurangi Harbour and Little Barrier Island (DDA at ambient temperatures. RoA for comparison within batch only)
site
ref
date.time
northing
easting
viz
sal
ipH
fpH
bio
RoA
Goat Island
G
20050212.1330
6546761
2672307
9.0
3.34
8.11
6.91
115
17
Ti Point
H
20050212.1400
6543141
2672298
11.2
3.21
8.15
7.25
49
7.8
Takatu Point
I
20050212.1425
6535277
2678195
9.7
3.36
8.14
7.12
69
22.4
Sandspit outside
J
20050212.1515
6532256
2666699
0.7
3.18
8.07
7.13
66
7.4
Mullet Point
K
20050212.1540
6527638
2670192
3.0
3.19
8.14
7.21
54
19.1
Scotts Landing
L
20050212.1615
6522576
2664517
1.0
3.28
8.08
7.29
43
17
Motuora I east
M
20050212.1700
6520877
2672128
10.2
3.34
8.21
7.23
53
5.3
Bon Accord Hr
N
20050213.1020
6529027
2675460
2.4
3.37
8.19
6.98
98
23
Flat Rock
O
20050213.1100
6526487
2683251
13.0
3.19
8.20
7.42
32
21.7
Jellicoe Channel
P
20050213.1140
6537452
2692824
16.0
3.38
8.25
7.35
39
11
Craddock Channel
Q
20050213.1230
6555079
2703533
13.0
3.39
8.21
7.43
31
12.5
Jellicoe Channel
R
20050213.1340
6552944
2684183
20.0
3.43
8.22
7.59
20
7.0
Inner Hauraki Gulf, Whangaparaoa to Auckland and Coromandel (DDA at ambient temperatures. RoA for comparison within batch only)
site
ref
date.time
northing
easting
viz
sal
ipH
fpH
bio
RoA
Gulf Hr outside
A
20050226.0940
6506451
2670461
4.5
3.37
8.11
6.88
124
12.6
Gulf Hr outside, 17m deep
B
20050226.1000
65055927
2670792
(0.5)
8.07
6.94
106
12.4
Murrays Bay
C
20050226.1030
6495414
2667884
3.2
3.41
8.02
6.89
119
13.4
Cheltenham Bch
D
20050226.1120
6484997
2672318
0.9
3.35
7.98
6.98
94
13.4
Waiheke Huruhi Bay
E
20050226.1205
6487201
2690711
2.2
3.26
8.06
7.16
60
7.5
Waiheke Te Matuku Bay
F
20050226.1300
6480499
2700424
2.2
3.41
8.02
6.90
116
11.8
Firth of Thames off Coromandel
G
20050226.1415
6487800
2714870
6.7
3.37
8.17
7.1
73
7.14
Firth of Thames, north
H
20050226.1515
6502236
2709224
10.0
3.39
8.12
7.05
82
8.3
Tiritiri south-east
I
20050226.1550
6502809
2690698
7.0
3.43
8.18
7.17
61
5.4
Tiritiri north
J
20050226.1630
6513426
2675979
6.3
3.28
8.17
7.04
84
5.4
Whangaparaoa north
K
20050226.1650
6510742
2674626
7.3
3.46
8.14
6.86
130
6.88
Gulf Harbour marina inside
L
20050226.1745
6506955
2670192
2.4
3.48
8.10
6.86
130
30
Manukau Harbour to Kaipara Harbour (DDA at 27ºC)
site
ref
date.time
northing
easting
viz
sal
ipH
fpH
bio
RoA
French Bay
L
20050305.1129
6471080
2658722
0.60
3.35
8.00
6.77
160
69
Cornwallis jetty
K
20050305.1211
6464324
2653207
1.4
3.39
8.10
6.72
182
36
Whatipu entrance
M
20050305.1330
6461476
2644429
2.0
3.36
8.11
6.79
154
51
Lower Nihotupu dam (fresh)
N
20050305.1430
6469833
2654281
(2)
0
7.78
6.45
339
13
Piha
O
20050305.1525
6471452
2641095
-
3.39
8.11
6.95
104
26
Muriwai
P
20050305.1700
6484692
2637576
-
3.43
8.10
7.03
85
28
Shelly Beach
Q
20050305.1745
6513638
2633874
0.8
3.38
8.08
7.02
85
25
Maunganui Bluff
E
20050329.1420
6603416
2562562
-
3.44
8.13
7.17
60
5.7
Baylys Bch
F
20050329.1510
6583144
2577469
-
3.48
8.20
7.03
87
6.9
Kawhia to Raglan (DDA at 27ºC)
site
ref
date.time
northing
easting
viz
sal
ipH
fpH
bio
RoA
Oporau bridge
M
20050327.1240
6348376
2677919
0.6
0.35
7.28
6.57
216
-
Upper Kawhia Hr
N
20050327.1300
6348267
2673926
0.3
3.18
7.95
6.98
93
37
Kawhia wharf
O
20050327.1315
6346989
2670079
0.9
3.31
8.13
6.99
95
18.5
Kawhia ocean beach
P
20050327.1400
6347061
2666607
(2)
3.38
8.17
6.94
108
14.6
Aotea Hr
Q
20050327.1430
6353502
2670207
1.5
3.38
8.17
7.18
59
11
Raglan wharf
R
20050327.1600
6376443
2674654
0.70
3.19
8.15
6.98
98
30
Raglan surf beach
S
20050327.1630
6374041
2669896
0.9
3.34
8.27
7.14
65
9.8
Whangarei to Poor Knights and Mimiwhangata (DDA at 27ºC)
site
ref
date.time
northing
easting
viz
sal
ipH
fpH
bio
RoA
Tutukaka boat ramp
M
20050402.0844
6619969
2649080
1.8
3.51
8.14
6.62
233
35
Tutukaka entrance
N
20050402.0900
6619351
2649724
5.6
3.49
8.18
6.84
138
20
Taiharuru Head
O
20050402.0930
6608766
2653064
12.4
3.50
8.21
6.96
103
15.5
Bream Island
P
20050402.1000
6594911
2654952
14.3
3.53
8.24
6.92
114
15.5
Whangarei Hr fairway
Q
20050402.1020
6589150
2650822
19.0
3.51
8.23
6.98
99
11
Sail Rock
R
20050402.1100
6575804
2663787
23.0
3.51
8.26
6.98
99
11
Chicken I east
S
20050402.1145
6588845
2672074
25.0
3.53
8.24
7.04
86
8.6
Chickens - Poor Knights halfway
T
20050402.1240
6611082
2670981
22.0
3.51
8.25
7.04
86
17
Poor Knights Rikoriko
U
20050402.1340
6633900
2667960
12.2
3.51
8.26
7.05
86
6.5
Poor Knights Canyon
V
20050402.1630
6635256
2668116
10.4
3.49
8.25
6.89
123
6.5
Rikoriko 0m depth
A
20050403.0920
6633873
2668018
13.8
3.5
8.23
6.51
303
45
Rikoriko 10m depth
8.22
6.95
107
17
Rikoriko 20m depth
8.23
7.01
92
10
Rikoriko 40m depth
8.20
6.98
99
10
Poor Knights- Mimiwhangata halfway
C
20050403.1140
6642618
2655642
11.2
3.53
8.26
7.01
92
6.8
Danger Rock
D
20050403.1230
6649496
2637939
9.0
3.51
8.26
-
-
12.5
Mimiwhangata Bay
E
20050403.1255
6640674
2639033
9.6
3.54
8.26
7.38
36
5.5
Elizabeth Reef
F
20050403.1330
6630789
2645733
7.4
3.54
8.27
7.29
46
4.6
Matapouri Bay
G
20050403.1400
6625432
2647836
5.8
3.51
8.22
7.22
55
6.8
Leigh - Te Arai - Mokohinau - Great Barrier (DDA at 27ºC. Alcohol-enhanced data from kept aquariums 4 weeks
later)
site
ref
date.time
northing
easting
viz
sal
ipH
fpH
bio
abio
RoA
Leigh wharf
D
20050416.0940
4.1
3.58
8.14
7.07
78
438
15
Leigh Hr entrance
E
20050416.1000
6544275
2673177
6.3
3.55
8.14
7.14
65
-
9.7
Leigh Hr entrance at 5m depth
F
20050416.1000
6544275
2673177
6.3
3.55
8.14
7.07
78
-
14
Leigh The Outpost
G
20050416.1015
6543935
2673784
9.5
3.52
8.12
7.18
59
-
10.6
Cape Rodney
H
20050416.1030
6545915
2674148
11.5
3.56
8.14
7.18
59
-
9.0
Te Arai Point
I
20050416.1210
6559243
2659657
13
3.53
8.17
7.22
53
253
9.6
Te Arai - Mokes halfway
J
20050416.1300
6568798
2677128
16
3.55
8.14
7.26
48
208
9.4
halfway at 10m depth
8.13
7.17
60
-
6.0
halfway at 20m depth
8.13
7.29
44
-
9.4
halfway at 40m depth
8.07
7.17
59
-
4.7
Mokohinau I west
L
20050416.1450
6584051
2697598
12.7
3.54
8.20
7.07
79
268
12
Territorial boundary
M
20050416.1540
6598780
2713995
15.7
3.52
8.17
7.40
33
228
5.3
boundary at 10m depth
8.17
7.35
38
-
4.5
boundary at 20m depth
8.16
7.26
45
-
15.6
boundary at 40m depth
8.15
7.23
52
-
9.8
The Needles north
O
20050416.1620
6577309
2728246
17.5
20.1
8.23
7.20
56
244
7.7
Arid Island east
P
20050417.1055
6561123
2737564
29
3.57
8.18
7.27
47
225
8
Pt Fitzroy wharf
Q
20050417.1425
6556719
2722846
6.4
3.55
8.19
7.23
52
-
12
Pt Fitzroy mussel farm
R
20050417.1445
6555820
2721372
17.5
3.55
8.16
7.31
42
242
9
Craddock Channel halfway
S
20050417.1530
6558224
2711502
11.7
3.55
8.19
7.31
42
203
8
Far North Kerikeri to Parengarenga to Waipapakauri (DDA at 27ºC)
site
ref
date.time
northing
easting
viz
sal
ipH
fpH
apH
bio
abio
RoA
Kerikeri inlet Te Tii
F
20050501.0730
6672127
2602339
-
3.69
8.04
6.93
6.32
111
470
5.4
Whangaroa Hr, old wharf
G
20050501.0915
6683663
2578833
1.9
3.65
8.18
6.83
6.37
141
420
25
Taupo Bay
H
20050501.1000
6689642
2575647
(4)
3.60
8.17
7.03
6.57
87
262
14.8
Mangonui wharf
I
20050501.1055
6690061
2559815
2.5
3.60
8.18
6.94
6.63
108
228
8.2
Cable Bay
J
20050501.1120
6690029
2554664
-
3.60
8.19
6.99
6.59
128
250
6.9
Rangaunu Hr Wairakia Pt
K
20050501.1240
6697737
2535393
7.8
3.61
8.16
6.87
6.51
128
302
11.2
Houhora wharf
L
20050501.1325
6709684
2521819
9.7
3.58
8.17
6.93
6.66
111
212
5.4
Henderson Pt
M
20050501.1400
6717812
2521611
(20)
3.58
8.17
6.88
6.51
125
302
4.6
Parengarenga Hr Te Paua
N
20050501.1530
6740781
2505907
-
3.61
8.18
6.99
6.61
96
239
16.3
Bluff off Te Kao
O
20050501.1600
6724040
2501497
-
3.59
8.16
6.96
6.69
103
198
10.8
Waipapakauri
P
20050501.1720
6684646
2526226
-
3.59
8.14
6.94
6.62
108
233
19.6
West Coast Port Waikato to Manukau Harbour (DDA at 27ºC)
 Summary
 In
reading the rates of attack (RoA in red) and biodensities (in green), it
may help to understand that there exists a relationship between plankton
density and underwater visibility. Phytoplankton reaches a maximum density
between 4 and 6 metre viz corresponding to about 90 hion. At around 10m
viz where biodensity measures half the maximum (about 40 hion), decomposers
may suddenly take over, causing also a sudden increase in biodensity. Thus
biodensities exceeding 90 hion are almost certainly attributable to decomposers
which in sunlit areas reach a combined maximum of around 130 hion. The
curves shown here serve to illustrate what happens on average, but the
actual composition of plankton assemblages is also important. Note that
salinity is critically important as fresh water can accommodate much higher
biodensity.
In
reading the rates of attack (RoA in red) and biodensities (in green), it
may help to understand that there exists a relationship between plankton
density and underwater visibility. Phytoplankton reaches a maximum density
between 4 and 6 metre viz corresponding to about 90 hion. At around 10m
viz where biodensity measures half the maximum (about 40 hion), decomposers
may suddenly take over, causing also a sudden increase in biodensity. Thus
biodensities exceeding 90 hion are almost certainly attributable to decomposers
which in sunlit areas reach a combined maximum of around 130 hion. The
curves shown here serve to illustrate what happens on average, but the
actual composition of plankton assemblages is also important. Note that
salinity is critically important as fresh water can accommodate much higher
biodensity. The
inner Hauraki Gulf contains very dirty water with high nutrient loads and
dense plankton. Treated sewage is discharged at Whangaparaoa (sites LAB),
the East Coast Bays (CD) with occasional spills of untreated sewage. This
expedition was done in a period of unusual calm weather, and also during
a neap tide. The DDA method had not been stabilised, hence the flat terraces
in the curves caused by the cooler nights. The red rectangle to measure
rates of attack with, has been stretched to approximate decay had temperature
been stabilised at 27ºC, but this has been judged unreliable for inclusion
on the summary map.
The
inner Hauraki Gulf contains very dirty water with high nutrient loads and
dense plankton. Treated sewage is discharged at Whangaparaoa (sites LAB),
the East Coast Bays (CD) with occasional spills of untreated sewage. This
expedition was done in a period of unusual calm weather, and also during
a neap tide. The DDA method had not been stabilised, hence the flat terraces
in the curves caused by the cooler nights. The red rectangle to measure
rates of attack with, has been stretched to approximate decay had temperature
been stabilised at 27ºC, but this has been judged unreliable for inclusion
on the summary map.
 The
waters sampled here show high quality with low biodensity in a patch of
blue water between Little Barrier and the mainland. Another patch of clean
water is represented by sites OPQ. Sites HIK have similar water qualities,
while J and N are expected to be poor, but Goat Island (G) has worst water
quality of all. In recent time, massive degradation has been observed at
Goat Island marine reserve perhaps because of an excess in seaweeds now
dying due to a lack of herbivores. There is also a plague of brown fluff,
a highly poisonous dinoflagellate mat.
The
waters sampled here show high quality with low biodensity in a patch of
blue water between Little Barrier and the mainland. Another patch of clean
water is represented by sites OPQ. Sites HIK have similar water qualities,
while J and N are expected to be poor, but Goat Island (G) has worst water
quality of all. In recent time, massive degradation has been observed at
Goat Island marine reserve perhaps because of an excess in seaweeds now
dying due to a lack of herbivores. There is also a plague of brown fluff,
a highly poisonous dinoflagellate mat.
 The
measurements shown here were fully temperature stabilised and standardised.
This 250km round trip attempted a long transect from Te Arai Point jutting
out from a long sandy ocean beach, towards the Mokohinau Islands and beyond
to the territorial boundary (IJLM). Surprisingly, the quality of the water
found at the Mokohinau Islands (The Mokes) had high biodensity and
RoA (12/79) compared with Leigh Harbour (15/78), both showing a flat elbow
from day 5. This could mean that their eventual biodensities would be much
higher had alcohol enhancement been used.
The
measurements shown here were fully temperature stabilised and standardised.
This 250km round trip attempted a long transect from Te Arai Point jutting
out from a long sandy ocean beach, towards the Mokohinau Islands and beyond
to the territorial boundary (IJLM). Surprisingly, the quality of the water
found at the Mokohinau Islands (The Mokes) had high biodensity and
RoA (12/79) compared with Leigh Harbour (15/78), both showing a flat elbow
from day 5. This could mean that their eventual biodensities would be much
higher had alcohol enhancement been used.
 This
long expedition saw a remarkable mix of waters and it gave some surprises
too. Beginning in Tutukaka Harbour, the water showed the RoA and biodensity
typical of an ingress of raw sewage (35/233) which restricts underwater
life considerably. Surprisingly we found a similar water quality at the
Poor Knights (45/303 at site A, near Rikoriko cave). Fortunately we also
carried out a depth survey which identified a shallow surface layer to
be the cause. However, none of the three sites measured gave values for
healthy plankton (U=48/86, V=48/123, A=45/303) and a similarity with near-coastal
Tutukaka harbour entrance can be seen. In recent times we have observed
steep degradation at the Poor Knights, particularly in the shallows. These
values make more sense when viewed together with the prograding Seafriends
aquariums.
This
long expedition saw a remarkable mix of waters and it gave some surprises
too. Beginning in Tutukaka Harbour, the water showed the RoA and biodensity
typical of an ingress of raw sewage (35/233) which restricts underwater
life considerably. Surprisingly we found a similar water quality at the
Poor Knights (45/303 at site A, near Rikoriko cave). Fortunately we also
carried out a depth survey which identified a shallow surface layer to
be the cause. However, none of the three sites measured gave values for
healthy plankton (U=48/86, V=48/123, A=45/303) and a similarity with near-coastal
Tutukaka harbour entrance can be seen. In recent times we have observed
steep degradation at the Poor Knights, particularly in the shallows. These
values make more sense when viewed together with the prograding Seafriends
aquariums.
 Along
the anchor chain we took samples at depths of 10, 20 and 40m in only three
places. Although visibility for these three places was rather disappointing
for this time of year (A=13.8m, B=16m, C=15.7m), plankton density was surprisingly
evenly spread down to 40m and possibly even deeper. Surprisingly, the Poor
Knights had much higher densities (92-107 hion) compared with the half-way
point between Te Arai and Mokohinau (site B=50-60 hion) and the territorial
boundary (site C= 33-52 hion). These densities cannot be explained from
the runoff from the land or from upwellings.
Along
the anchor chain we took samples at depths of 10, 20 and 40m in only three
places. Although visibility for these three places was rather disappointing
for this time of year (A=13.8m, B=16m, C=15.7m), plankton density was surprisingly
evenly spread down to 40m and possibly even deeper. Surprisingly, the Poor
Knights had much higher densities (92-107 hion) compared with the half-way
point between Te Arai and Mokohinau (site B=50-60 hion) and the territorial
boundary (site C= 33-52 hion). These densities cannot be explained from
the runoff from the land or from upwellings.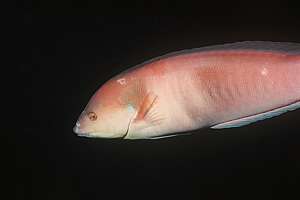
 The
Far North measurements shown here were all done by car such that there
exists a strong need to get data from further out in sea. Very high RoA
and density was observed in the Kerikeri inlet near Te Tii (37/129) which
we classify as killer plankton. Similar density but with substantially
less chronic decay (25/141) was encountered in Whangaroa Harbour, once
very rich in fish and other life but now suffering from high levels of
degradation. However, oysters tolerate these conditions. By comparison,
Parengarenga Harbour (site O) combined medium decay with high biodensity
(16/96), similar to the Rangaunu Harbour (site K with 11/128) and Mangonui
Harbour (site I with 8/108). In these three places young fish were found,
energetically feeding on zoo plankton (jack mackerel, parore, piper). A
substantial difference in RoA was found between west coast sites P (11/103)
and Q (20/108).
The
Far North measurements shown here were all done by car such that there
exists a strong need to get data from further out in sea. Very high RoA
and density was observed in the Kerikeri inlet near Te Tii (37/129) which
we classify as killer plankton. Similar density but with substantially
less chronic decay (25/141) was encountered in Whangaroa Harbour, once
very rich in fish and other life but now suffering from high levels of
degradation. However, oysters tolerate these conditions. By comparison,
Parengarenga Harbour (site O) combined medium decay with high biodensity
(16/96), similar to the Rangaunu Harbour (site K with 11/128) and Mangonui
Harbour (site I with 8/108). In these three places young fish were found,
energetically feeding on zoo plankton (jack mackerel, parore, piper). A
substantial difference in RoA was found between west coast sites P (11/103)
and Q (20/108). West
Coast waters are plagued by heavy sediment and nutrient loads from the
Waikato River, the Auckland sewage works and the northern branch of the
Kaipara Harbour. Decomposition rates are high and biodensities about the
maximum that sunlight can maintain. Even so, there must be an excess in
unused nutrients so high that the water can spread far out to sea and along
the coast while retaining high biodensity (100-120). We postulate that
this water flows north, around North Cape and then back south again and
that its furthest boundary now engulfs even the Poor Knights Islands. Our
measurements show that this is more than just a possibility.
West
Coast waters are plagued by heavy sediment and nutrient loads from the
Waikato River, the Auckland sewage works and the northern branch of the
Kaipara Harbour. Decomposition rates are high and biodensities about the
maximum that sunlight can maintain. Even so, there must be an excess in
unused nutrients so high that the water can spread far out to sea and along
the coast while retaining high biodensity (100-120). We postulate that
this water flows north, around North Cape and then back south again and
that its furthest boundary now engulfs even the Poor Knights Islands. Our
measurements show that this is more than just a possibility.
 The
Waikato River enters the sea through a narrow estuary. The inflow was measured
at the Tuakau bridge after a long period of no rains with a moderate biodensity
but very high decay (site O=100/238). Inside this estuary the fresh water
mixes with salt which makes it less solvent. Whereas fresh water of pH
7.5-8 can carry a high biodensity in plankton, salt water is limited to
about 90-100 hion. All freshwater plankton dies and becomes decomposed.
Saltwater plankton grows from the available nutrients but excess nutrients
remain. At Port Waikato (site N=17/126) about half the nutrients have been
converted.
The
Waikato River enters the sea through a narrow estuary. The inflow was measured
at the Tuakau bridge after a long period of no rains with a moderate biodensity
but very high decay (site O=100/238). Inside this estuary the fresh water
mixes with salt which makes it less solvent. Whereas fresh water of pH
7.5-8 can carry a high biodensity in plankton, salt water is limited to
about 90-100 hion. All freshwater plankton dies and becomes decomposed.
Saltwater plankton grows from the available nutrients but excess nutrients
remain. At Port Waikato (site N=17/126) about half the nutrients have been
converted.
 The
Kawhia to Raglan stretch was also done by car, yielding only near-coastal
samples. The steep elbow in samples NRO suggest that decay was energy-limited
and would have shown higher densities if enhanced by alcohol. But the results
show what was to be expected, a fully developed plankton assemblage at
maximum density and medium to high decay rates, with a slight exception
of Aotea Harbour and Raglan surf beach (sites Q, S)
The
Kawhia to Raglan stretch was also done by car, yielding only near-coastal
samples. The steep elbow in samples NRO suggest that decay was energy-limited
and would have shown higher densities if enhanced by alcohol. But the results
show what was to be expected, a fully developed plankton assemblage at
maximum density and medium to high decay rates, with a slight exception
of Aotea Harbour and Raglan surf beach (sites Q, S)